Quick Start
Pyplan running on Desktop
In case you installed Pyplan on your computer, as soon as launching Pyplan you will reach the app land page, which looks like the following picture:
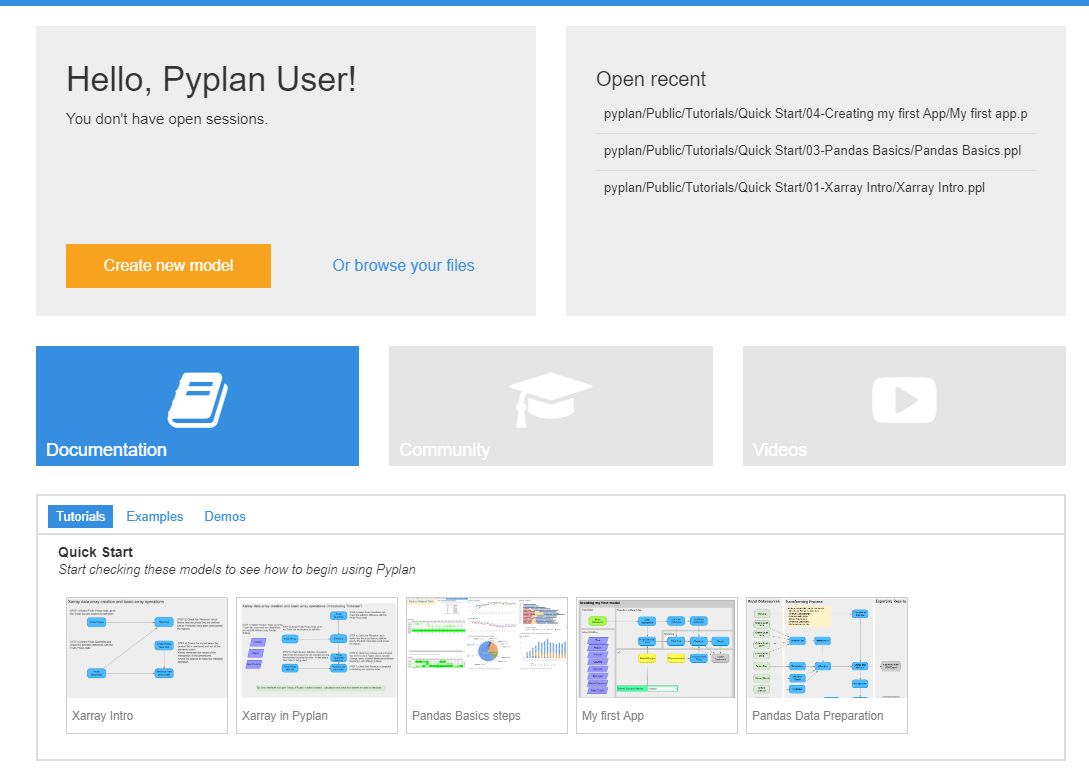 Here you will find sections for creating a new model, opening recent models, recovering any active session, or opening tutorials and examples. Click on “Create new” to create a new model.
Pyplan Cloud
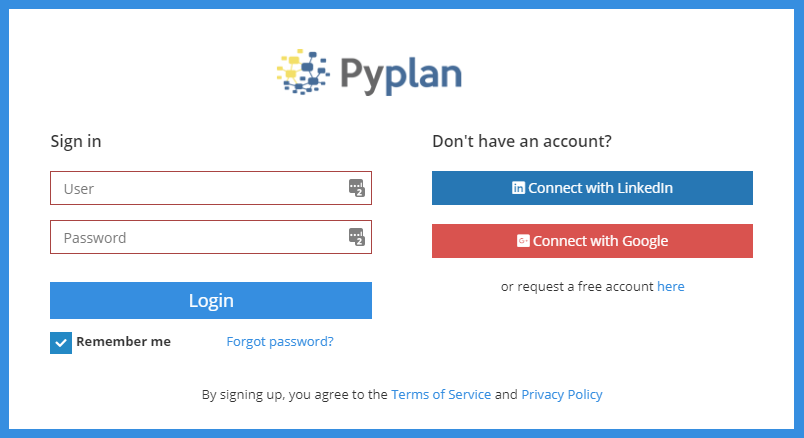
You can also access Pyplan cloud environment at https://my.pyplan.com You must login with your LinkedIn or Google account, or request an account to access Pyplan cloud services here.
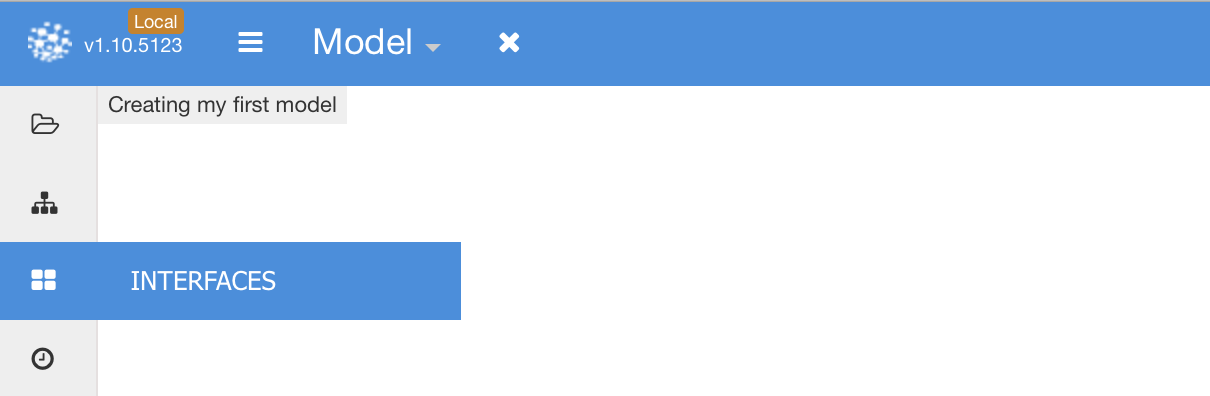
Homepage Menu
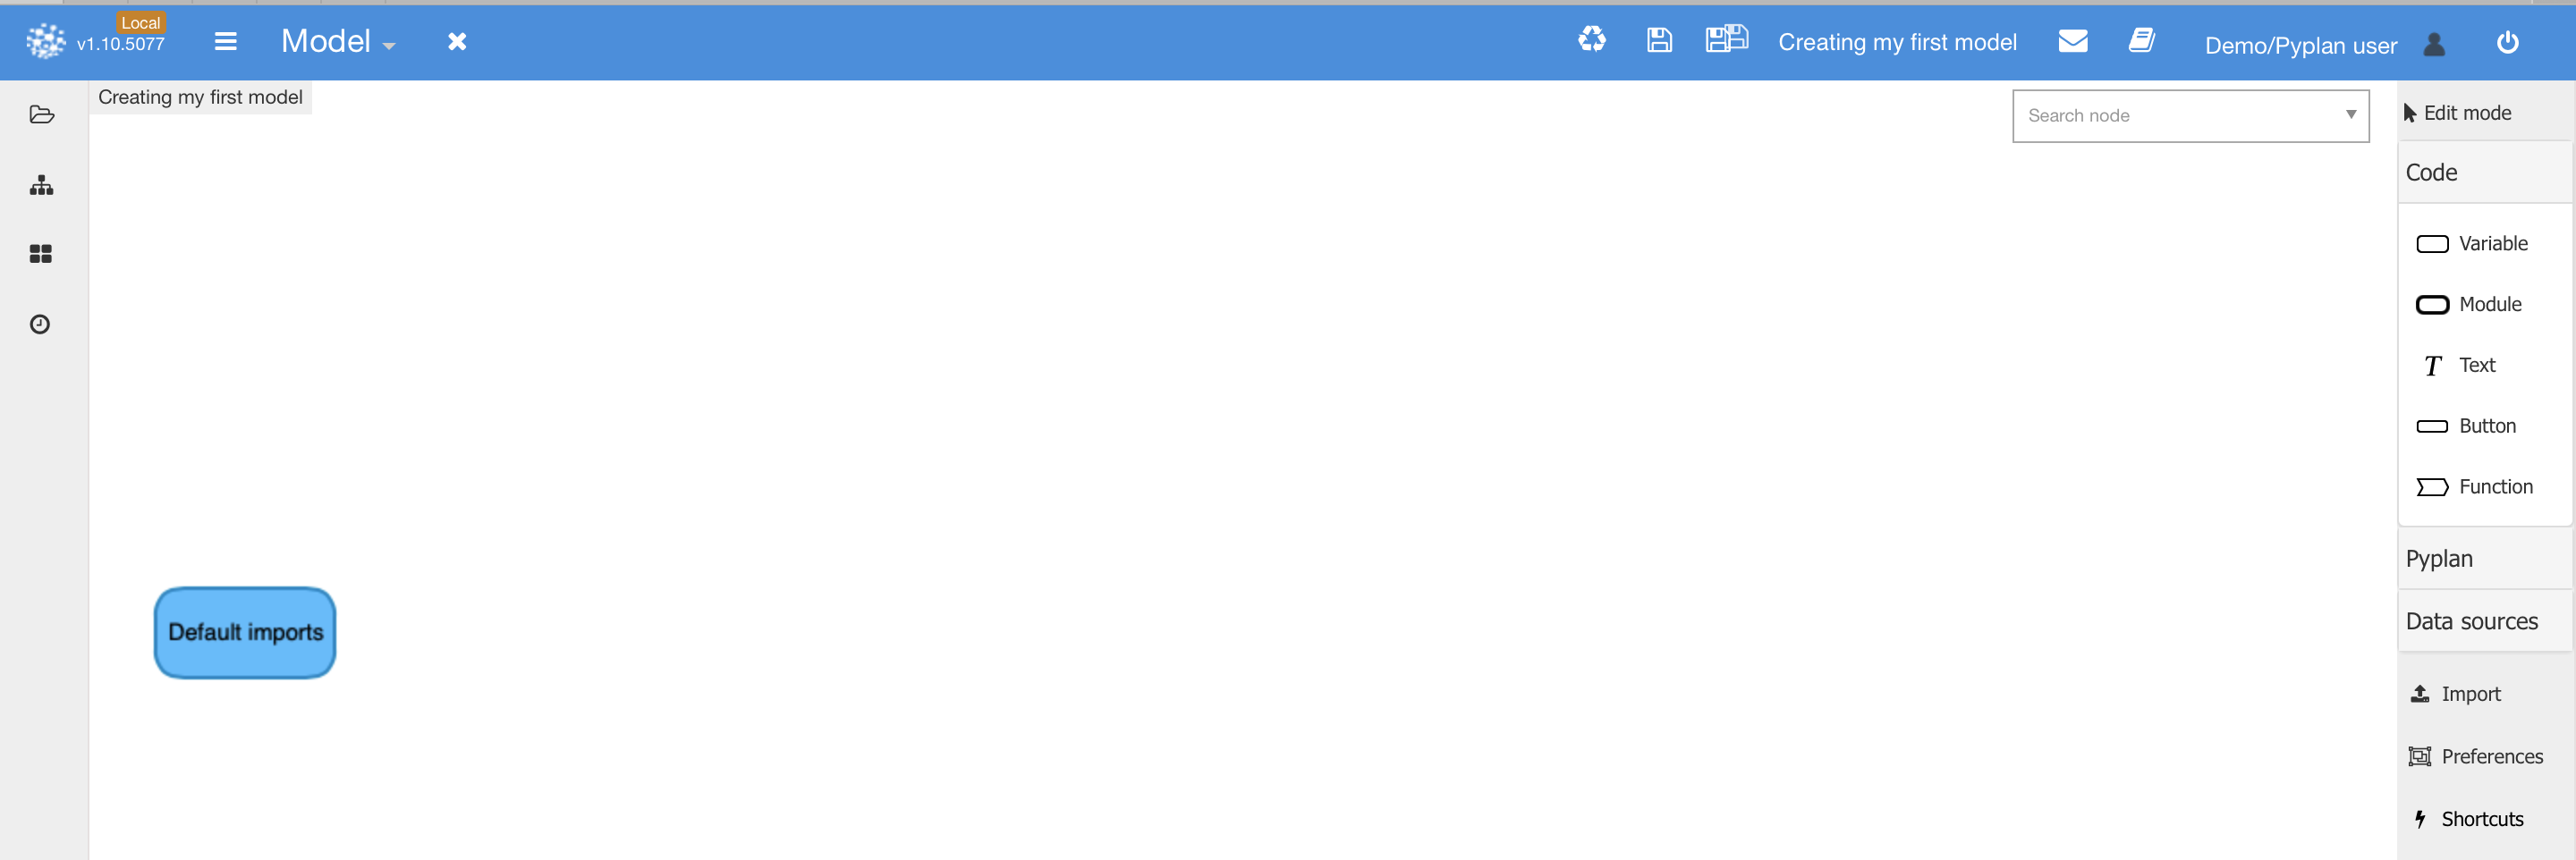
After the new model workspace has been created, you will access the sandbox for creating the logic of your model.
Modeling Business Rules
The basic objects for creating and organizing the calculation logic are grouped in a toolbar titled “Code”. You will find it on the right side of the modeling interface.
Node
A node is the place where you code, in pure Python, the calculation logic for the data analytics app. The app logic usually starts loading data from an external data source. Different types of analyses can be conducted in separate nodes or groups of nodes, which can either share or not steps in the calculation logic. At the end, some nodes will collect the results that will be shown as outputs of the app.
Let’s create a simple analysis to understand how Pyplan works. As a first step, drag and drop a “Node” into the canvas, and enter a Title: “My first node”. After accepting the title (or pressing the TAB key), an ID will be automatically provided
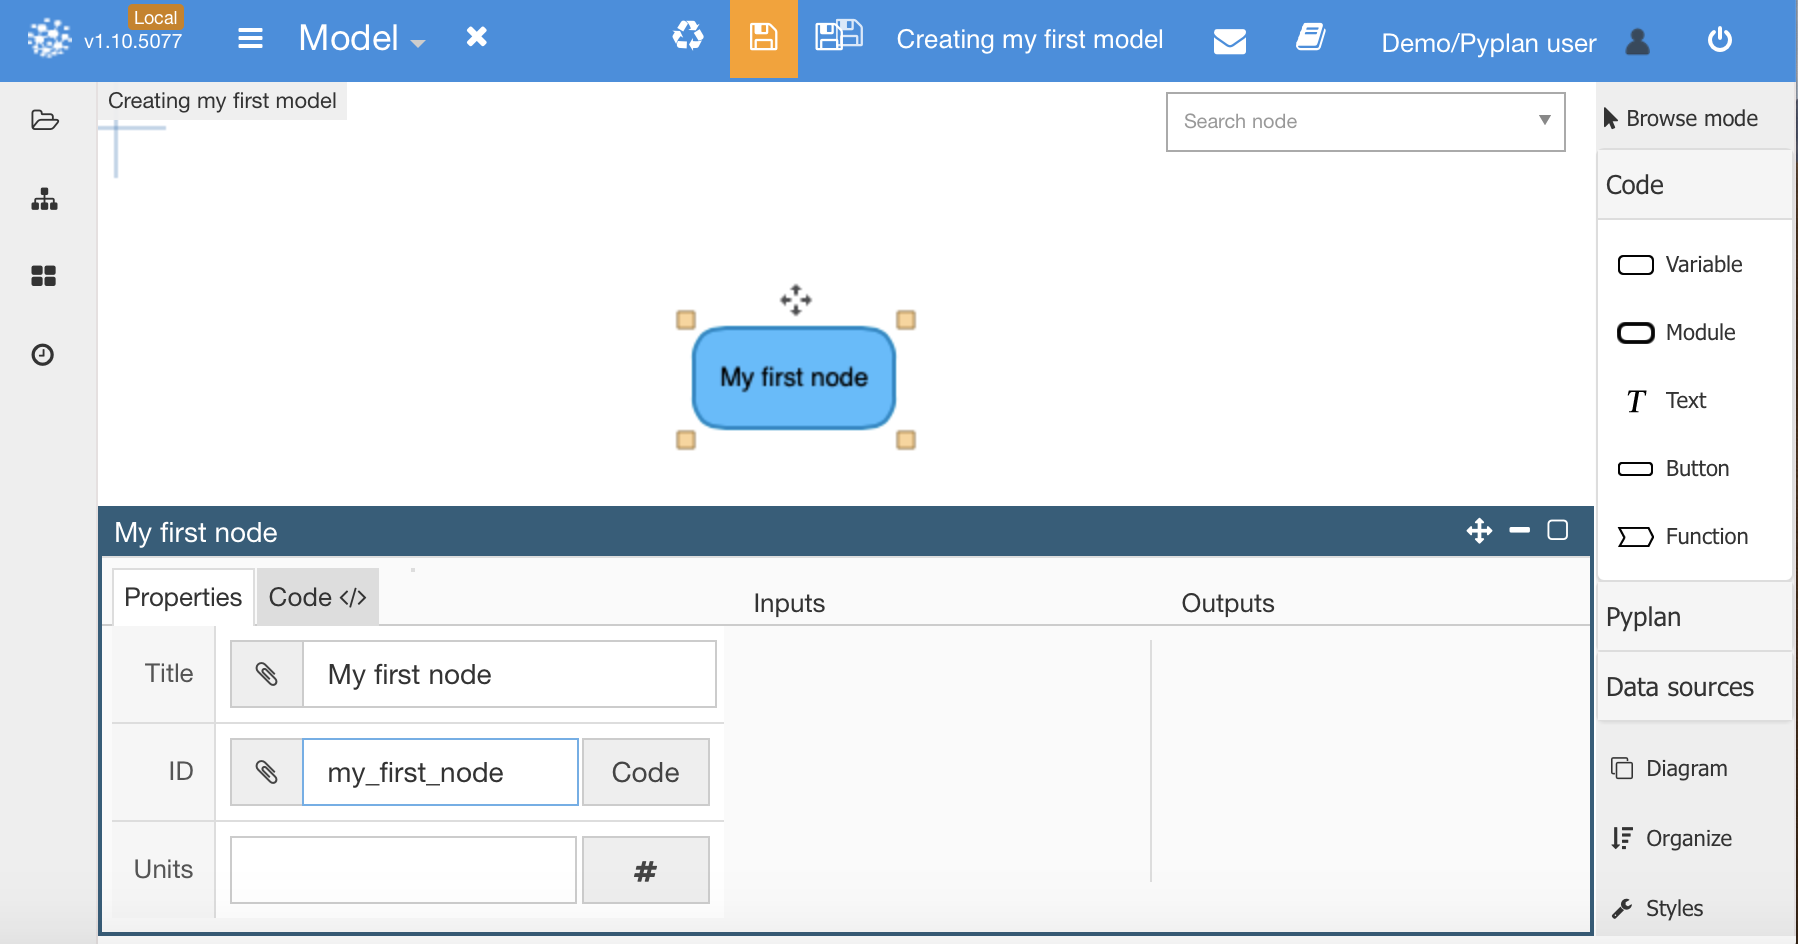
Then, copy the following code and click on the Code tab:
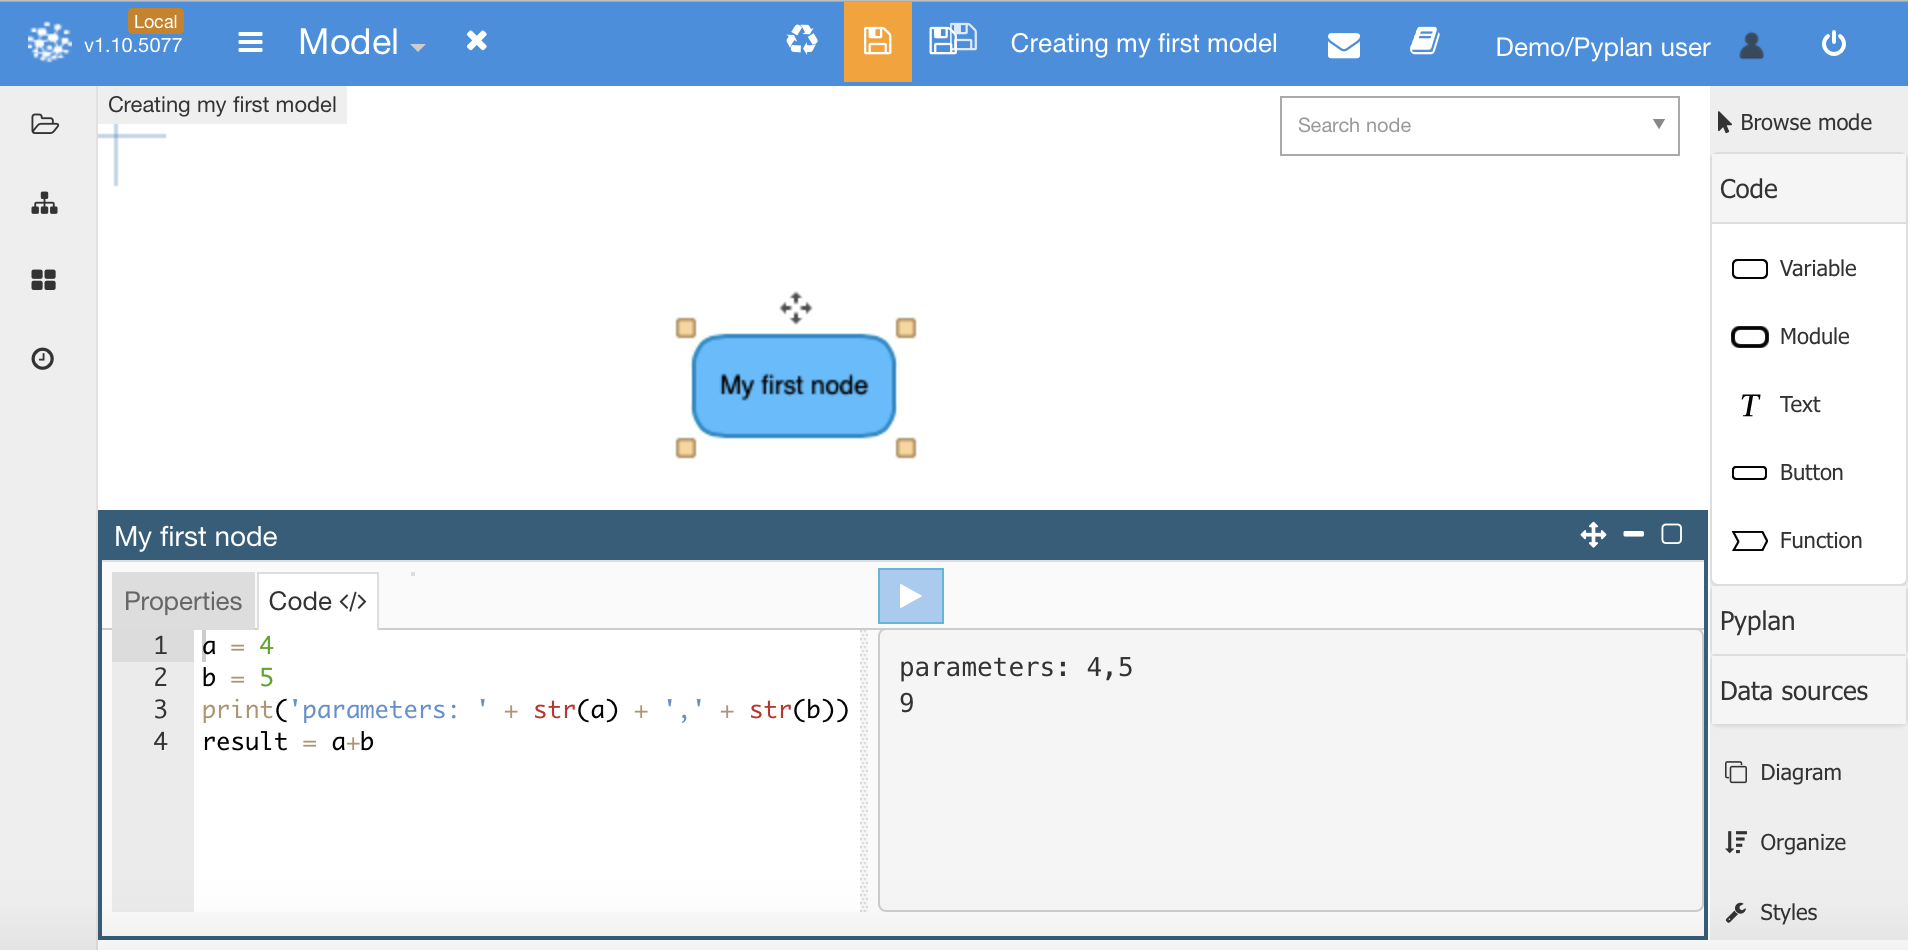
a = 4
b = 5
print('parameters: ' + str(a) + ',' + str(b))
result = a+b
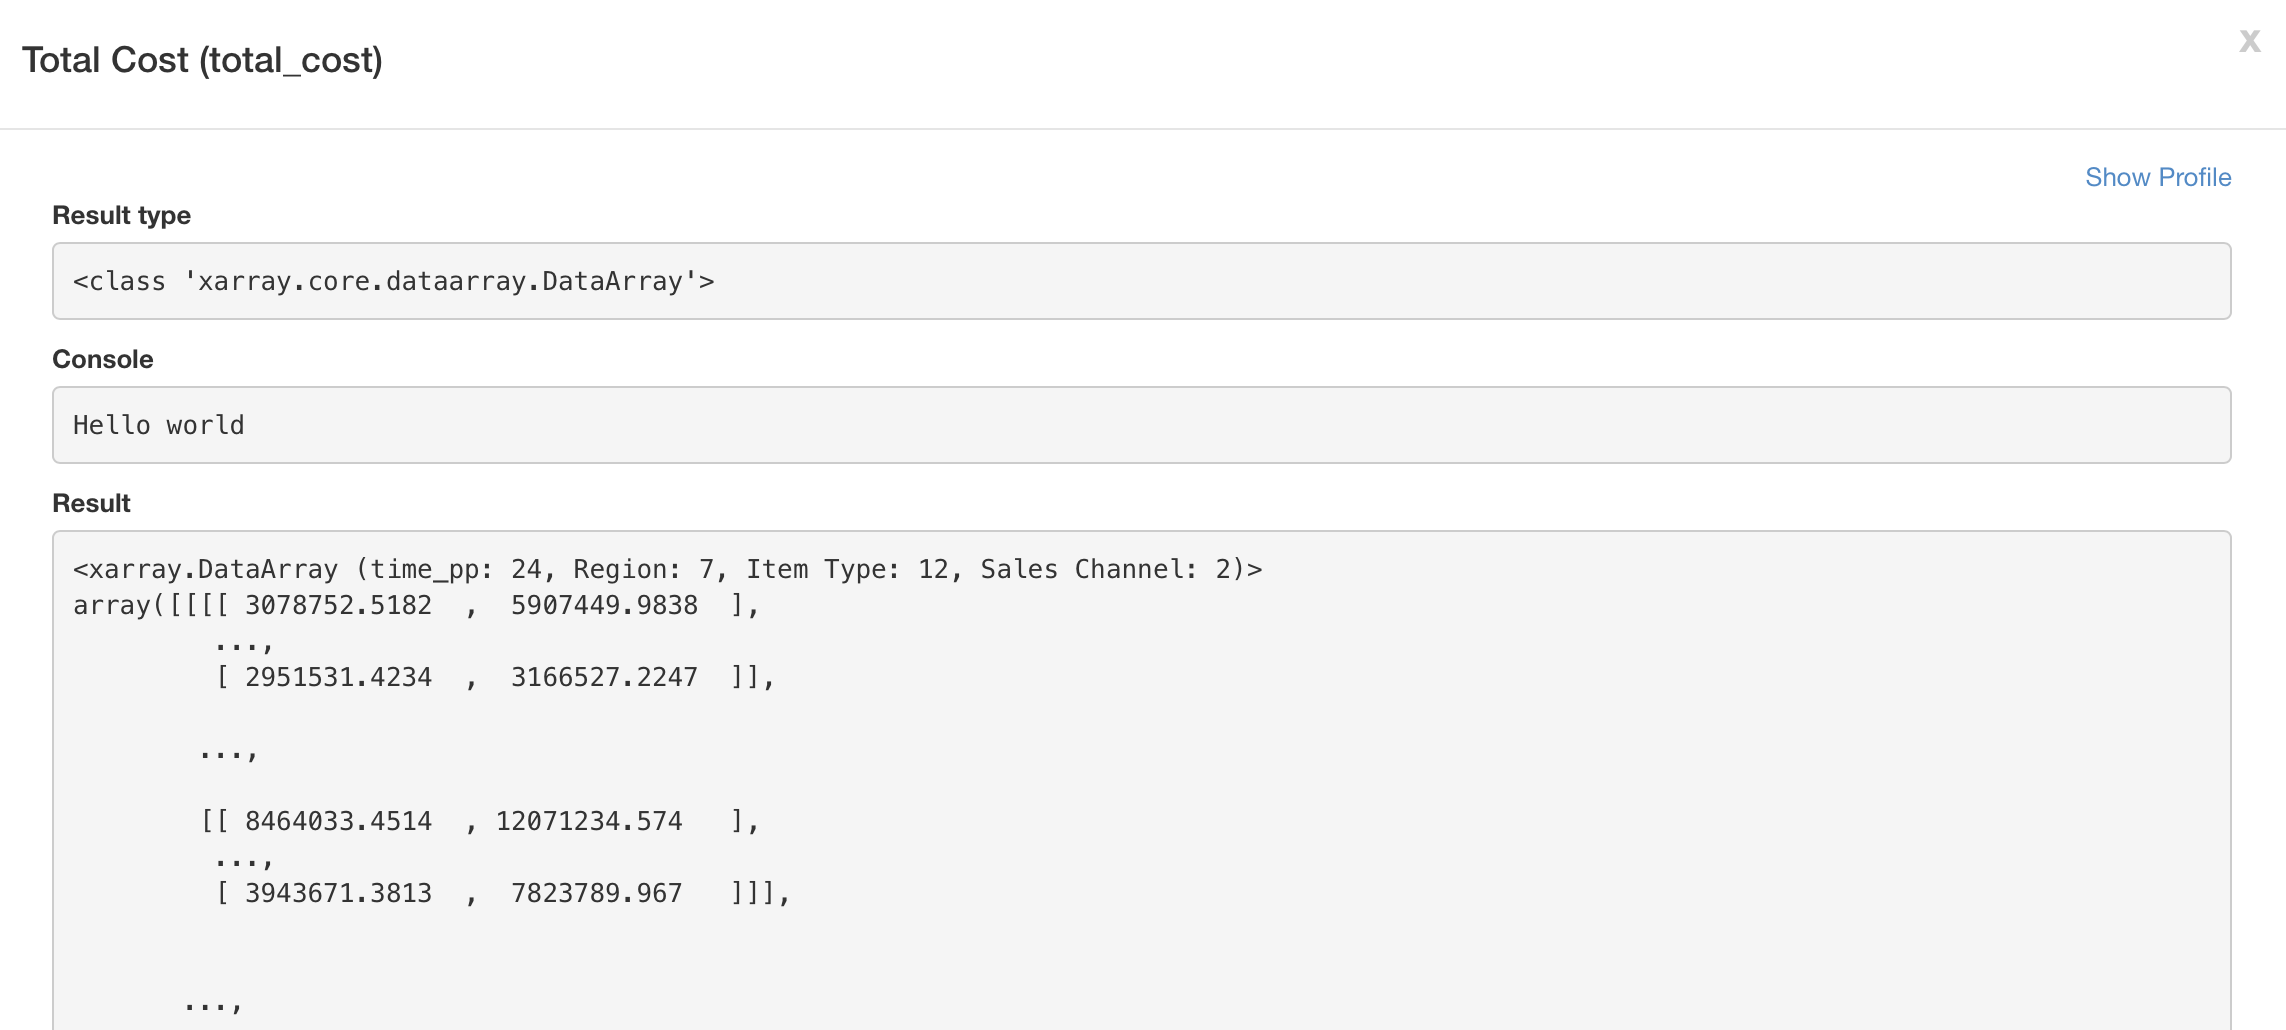
Paste your Python code on the left side of the “Code” tab. The console output will be displayed on the right side. After clicking the “run” button on the same tab, you should see something like this:
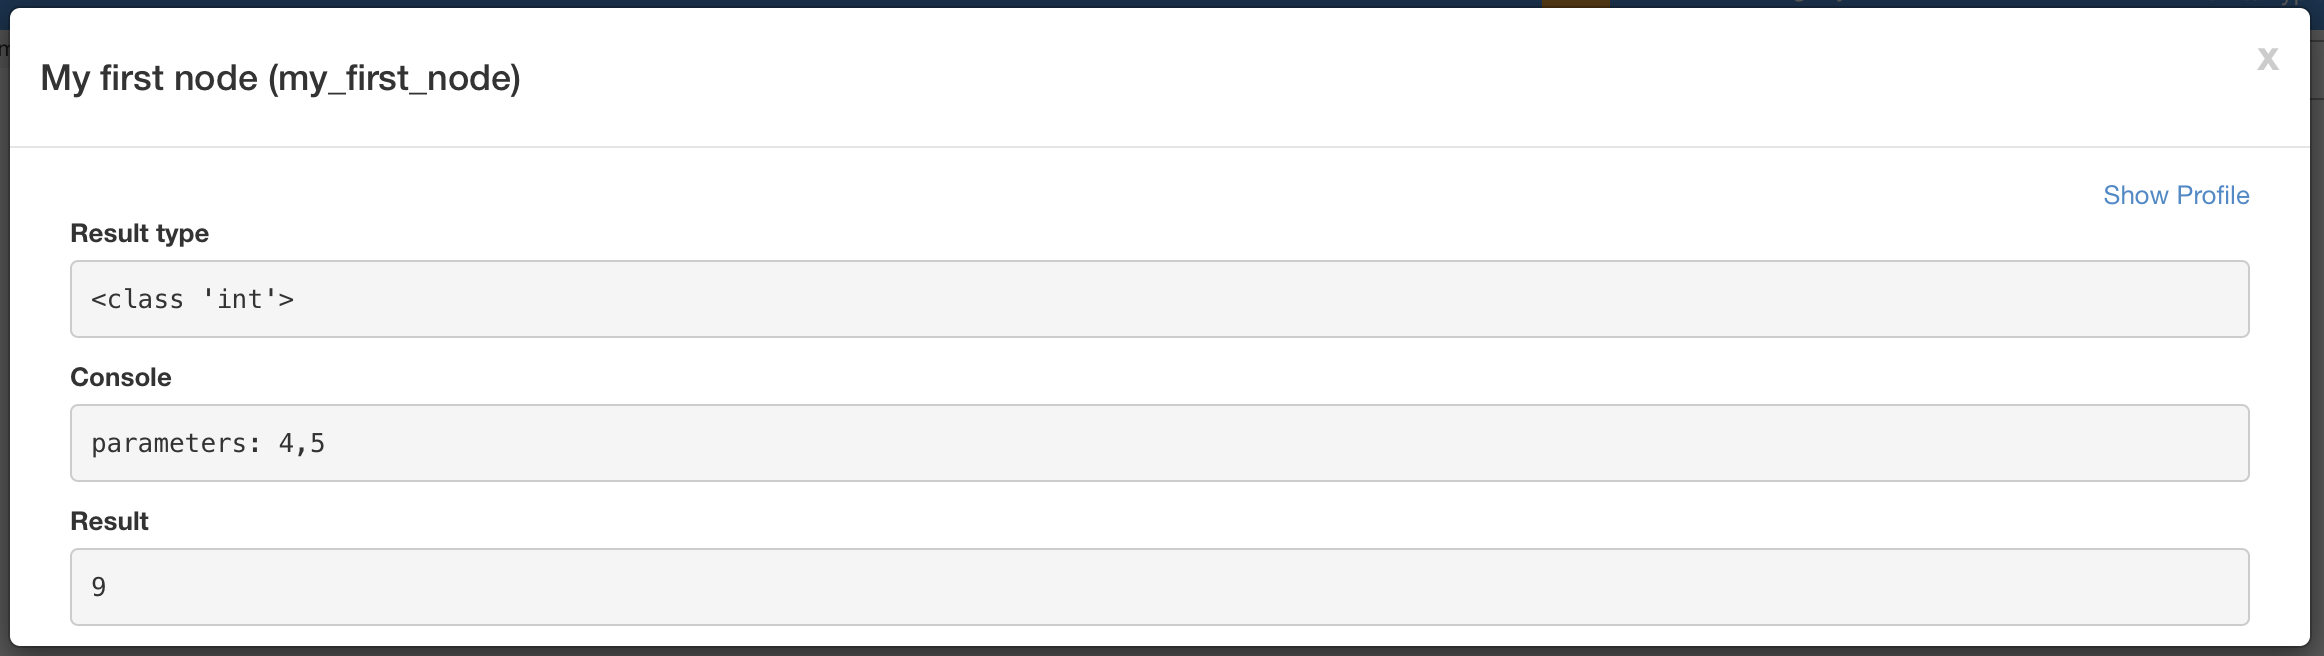
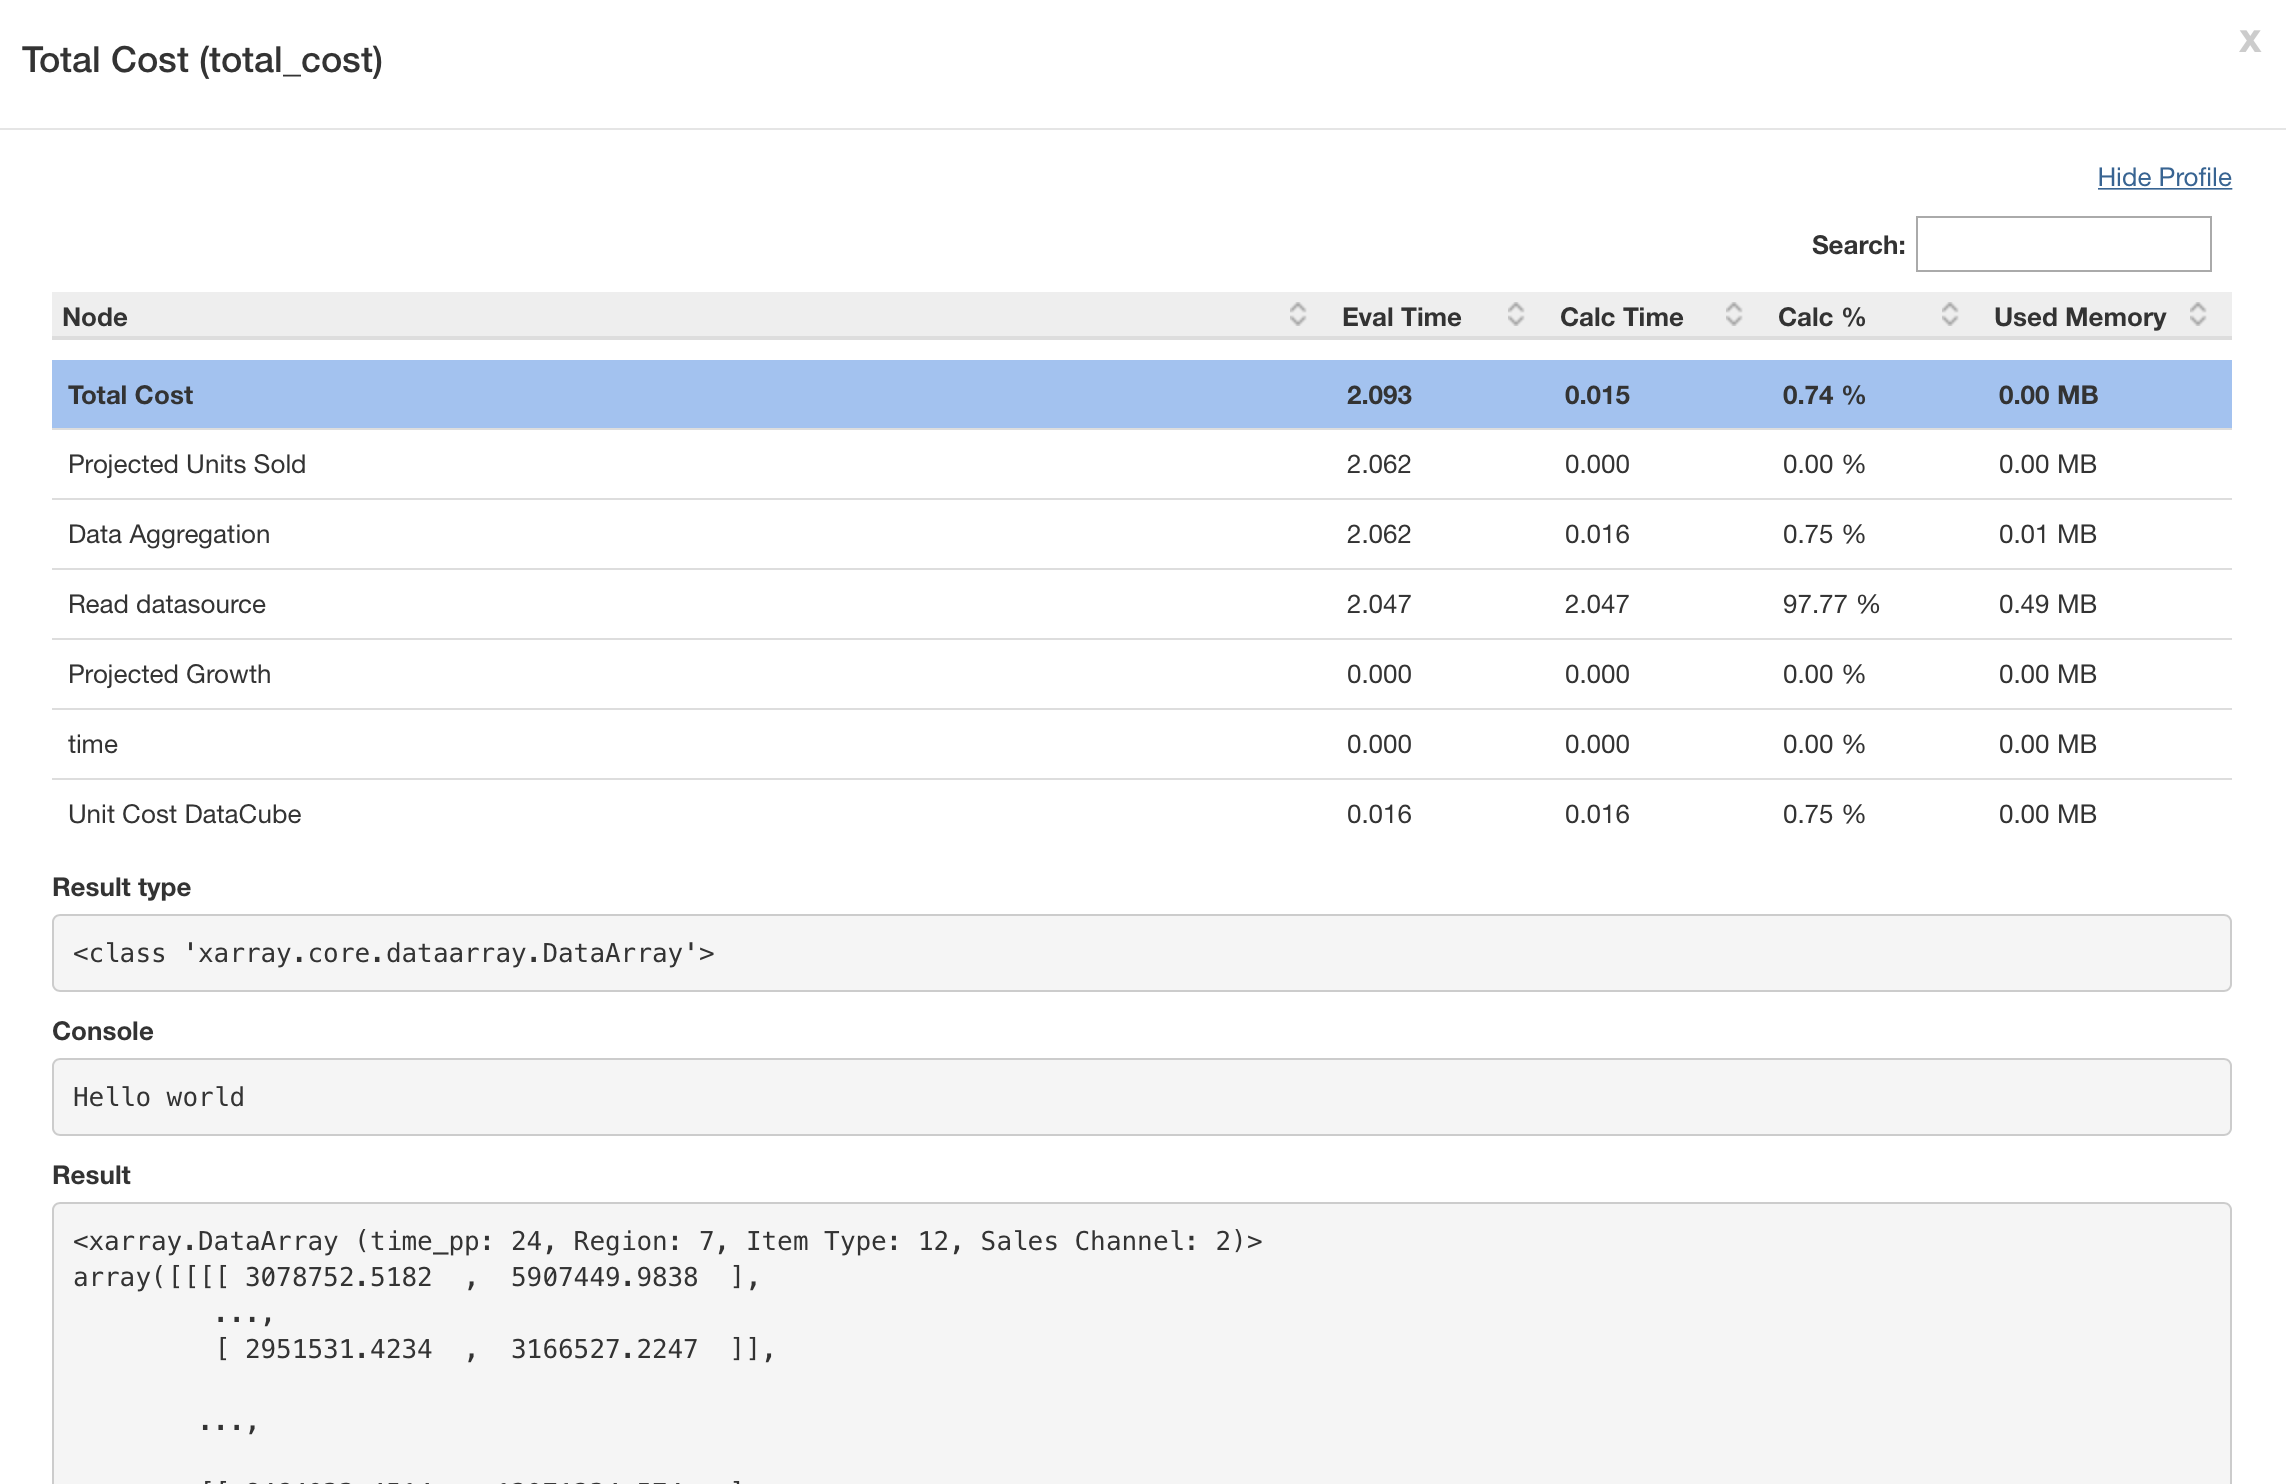
While the node is selected , if you press Ctrl+R or double click it, the result will be shown, which is 9 in this case. You can appreciate the difference between the console output and the node result. An alternative way to evaluate a node is by pressing Ctrl+E. In this case, not only the console and result output will be displayed, but also additional information (as data type) will be shown. It is also possible to inspect the calculation performance by clicking on Show Profile which allows you to fine-tune your code.
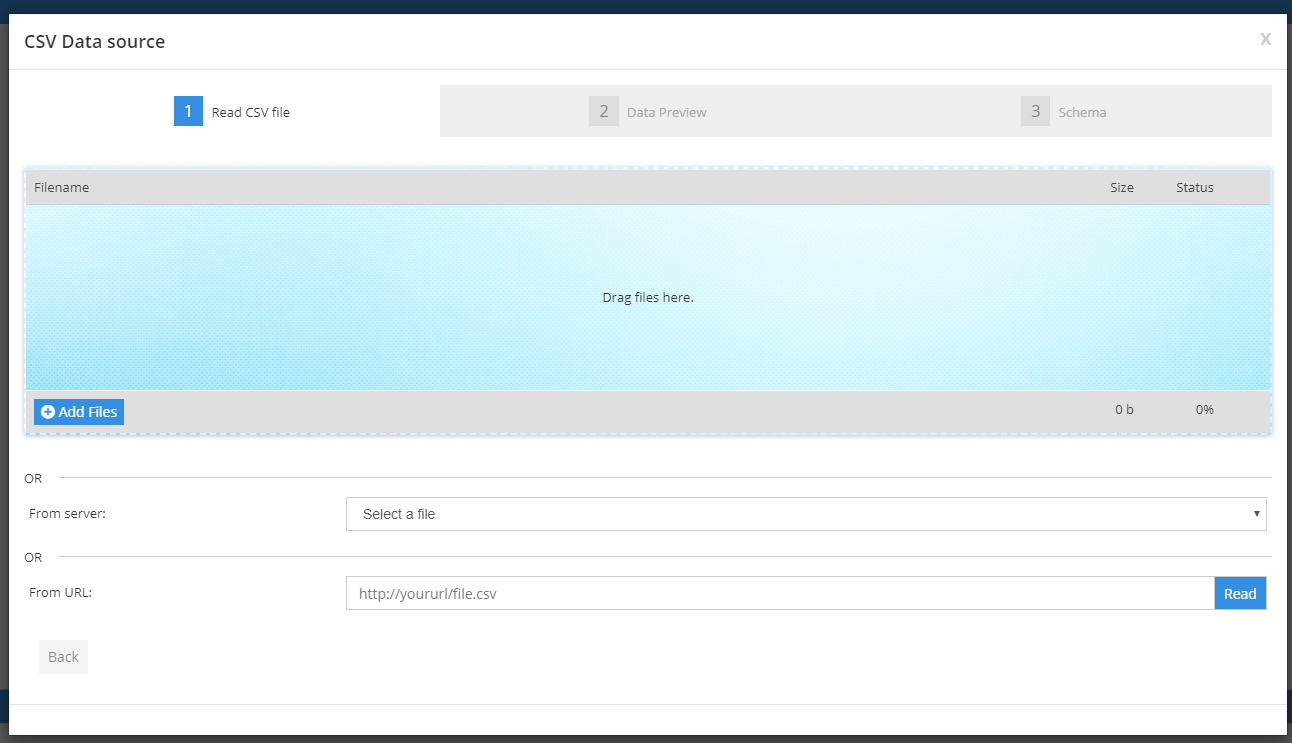
Create another node, draging and dropping a node called “CSV” that you will find in the “Data sources” section on the right menu.
 Then:
Then:
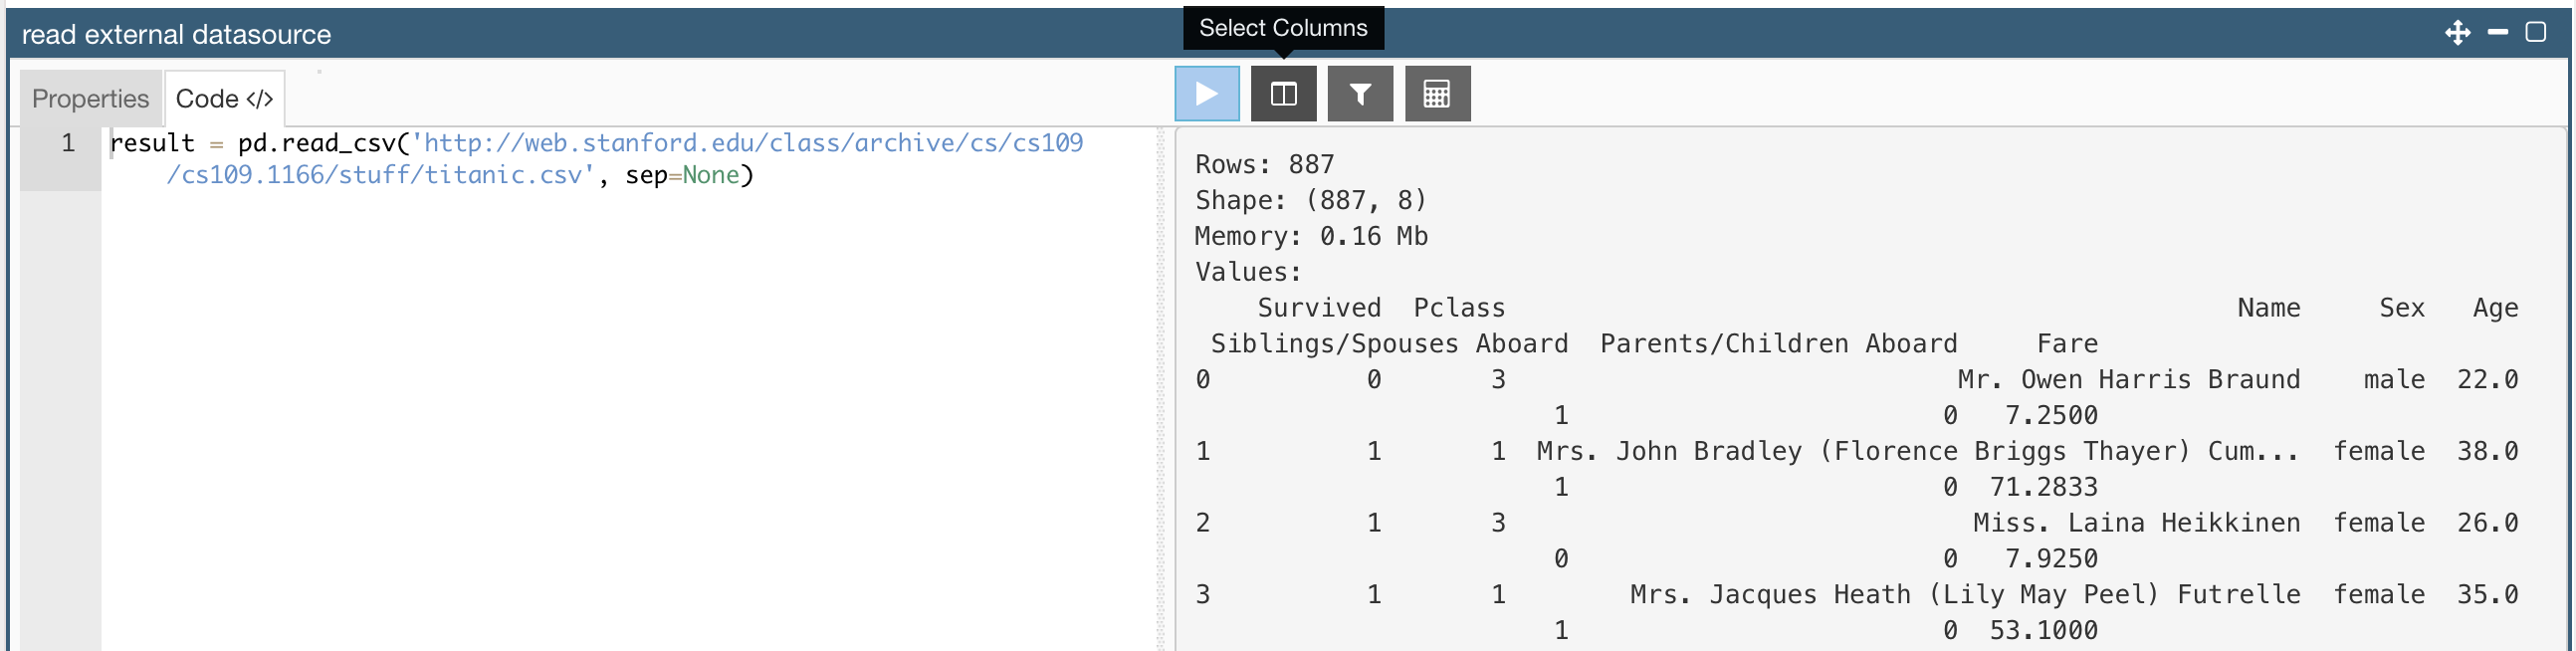
 Then set its definition as:
result = pd.read_csv('http://web.stanford.edu/class/archive/cs/cs109/cs109.1166/stuff/titanic.csv', sep=None)
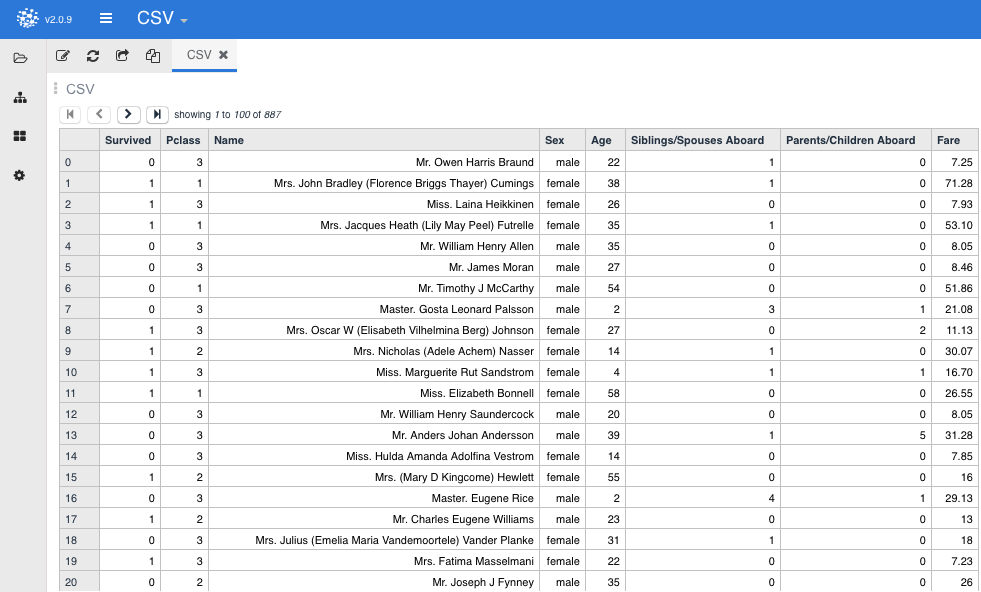
You can inspect again the difference between the console output vs the node evaluation (Ctrl+R or double click). While the console output is pure text, Pyplan shows the result in a formatted table.
If you inspect the “Code” tab of the node, you will find new buttons next to the “Run” button . These buttons are displayed whenever a node evaluates a Dataframe/Pandas object type. The buttons provide a link to Pandas wizards to help Python beginners start learning how to use Pandas. Wizards allow you to select and filter data or create new calculation fields. The resulting code will be displayed on the left-hand code section for you to pick up from there.
Module
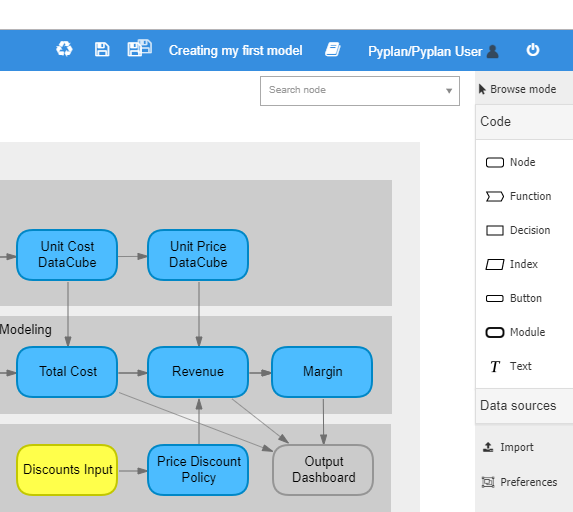
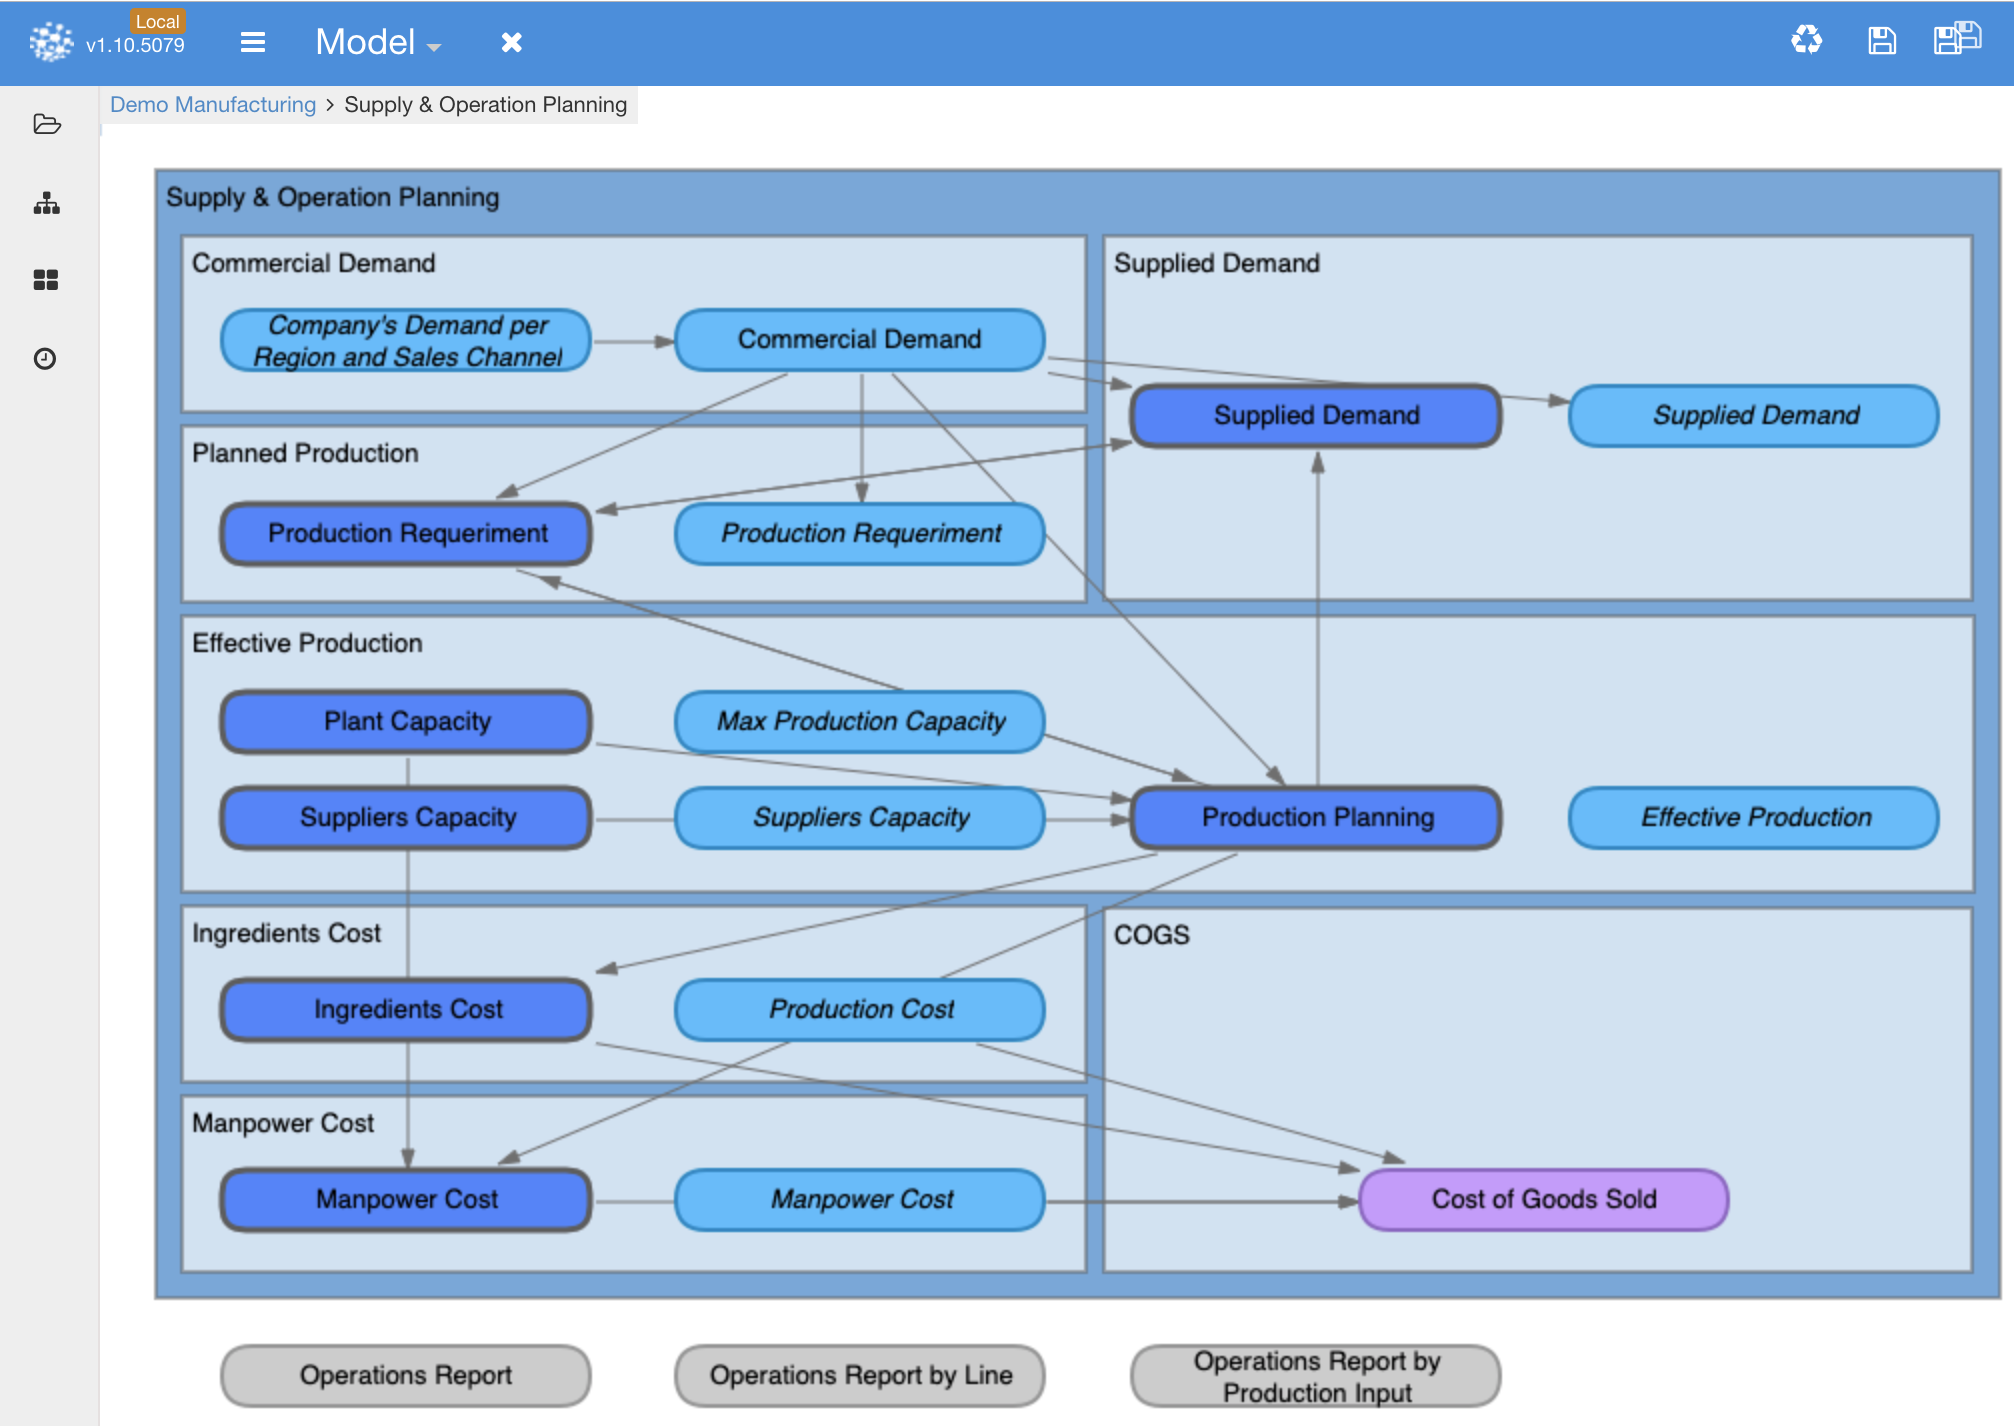
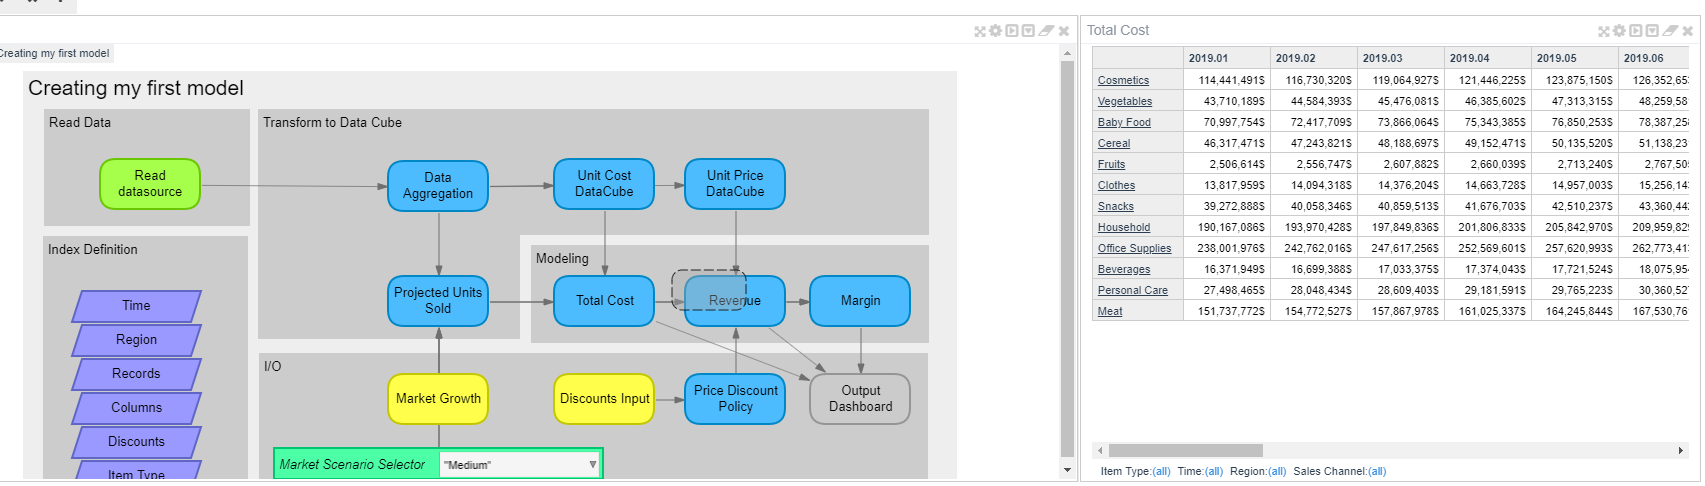
Modules are meant to contain groups of nodes as a means of organizing large models. For example, if your model is an integrated planning tool of a manufacturing company, the influence diagram would look like this:
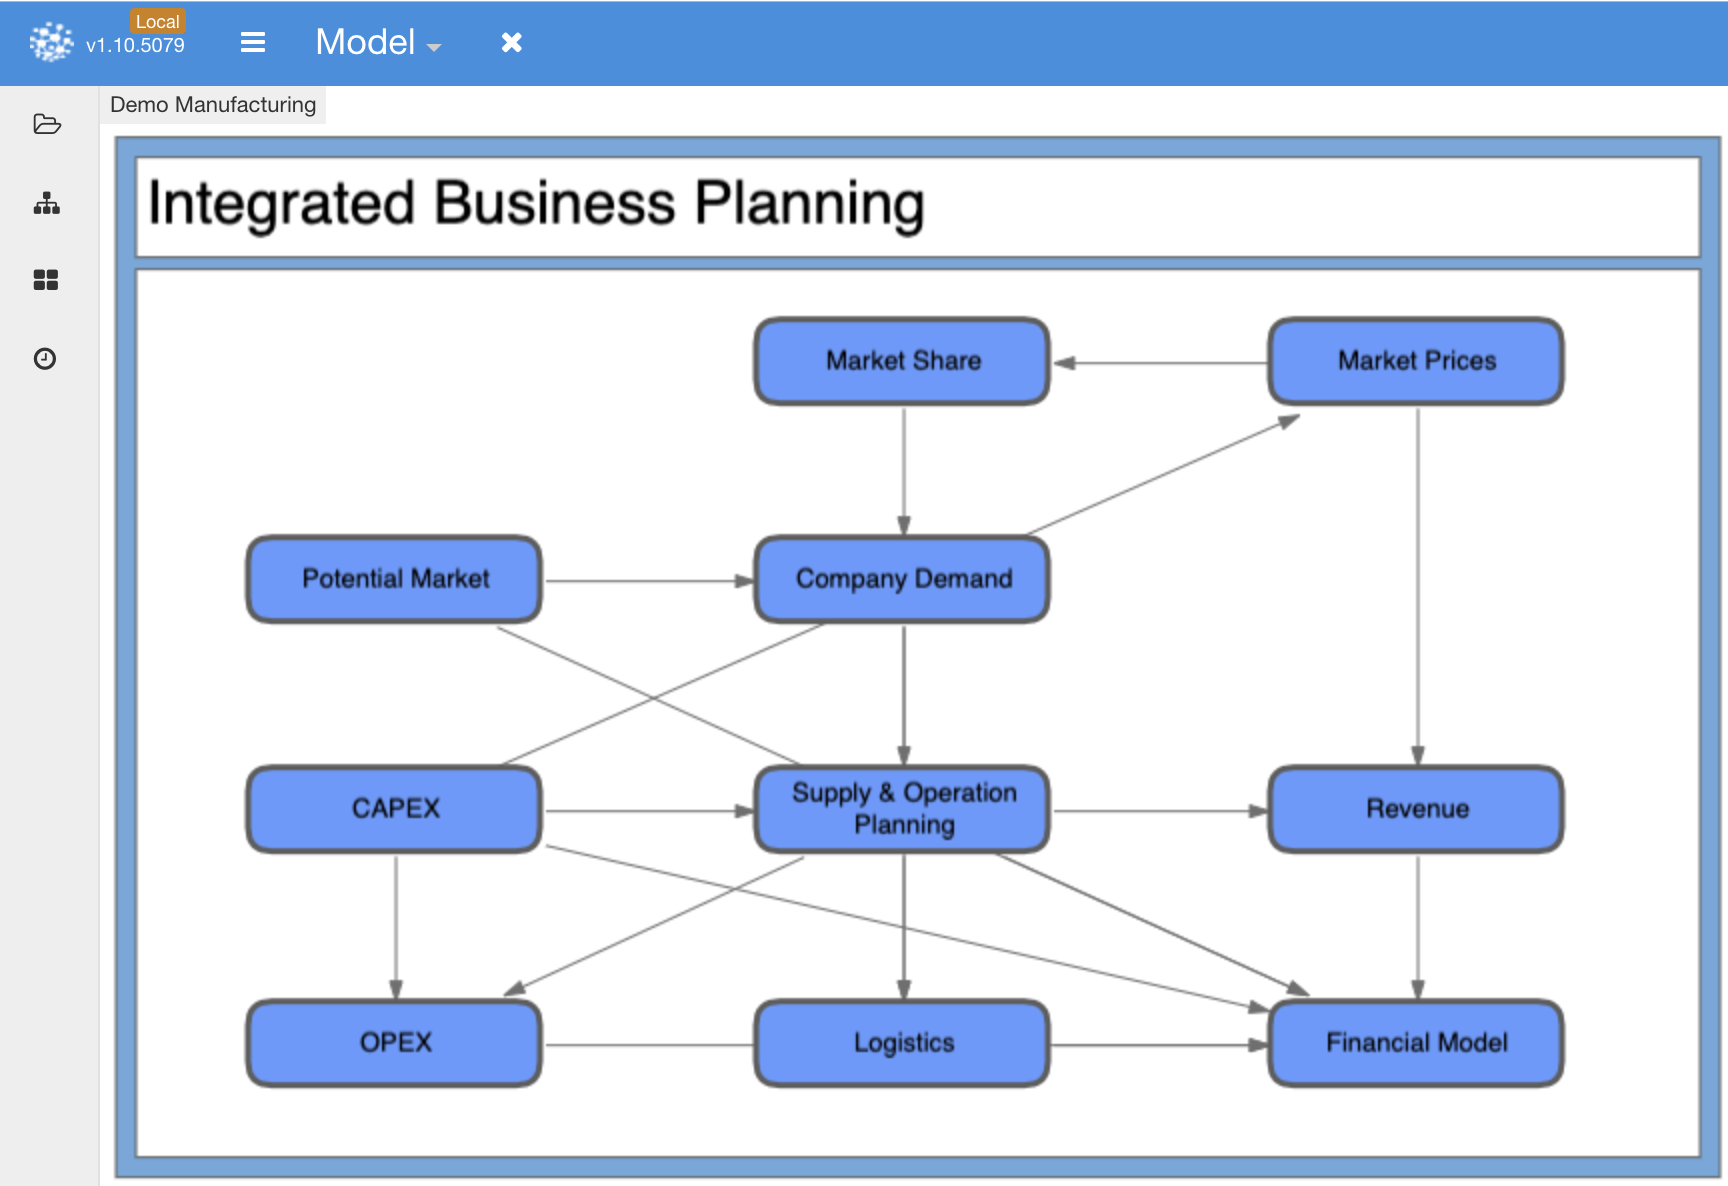
Where each module contains the underlying logic of each area of the company. In this example, the Supply & Operation Planning Module looks like this:
Evaluating and Visualizing Data
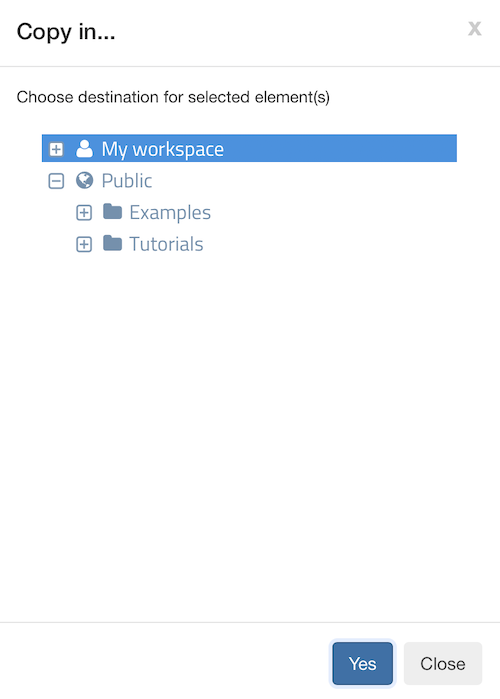
In order to explore the evaluation and visualization alternatives, let’s copy onto your own workspace the app called “My First App.ppl,” which you will find in the “My First App.ppl” (Public/Tutorials/04-Creating mi first App/” folder. After selecting it, click on the “Copy in” section as shown in the figure below:

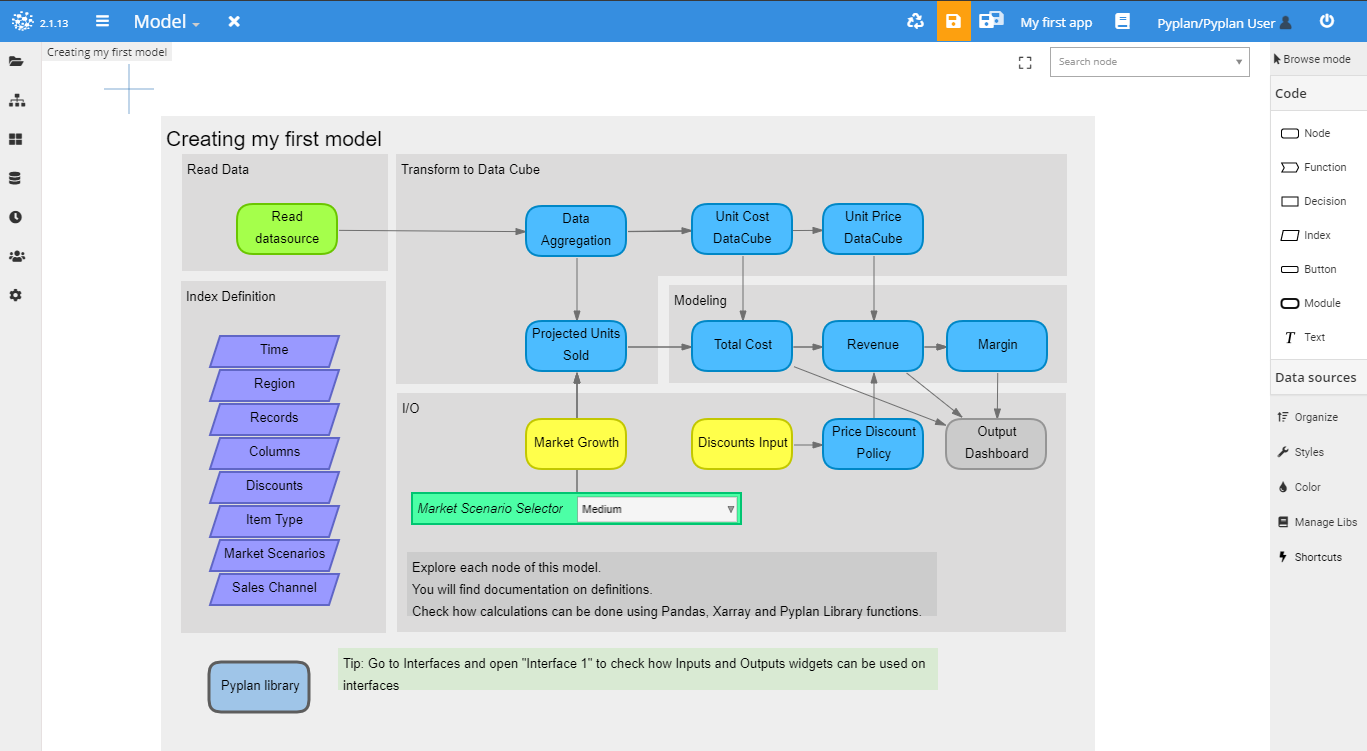
Now open the copied file and then go to the model (Double-Click to open the model). You should be able to see the following diagram:
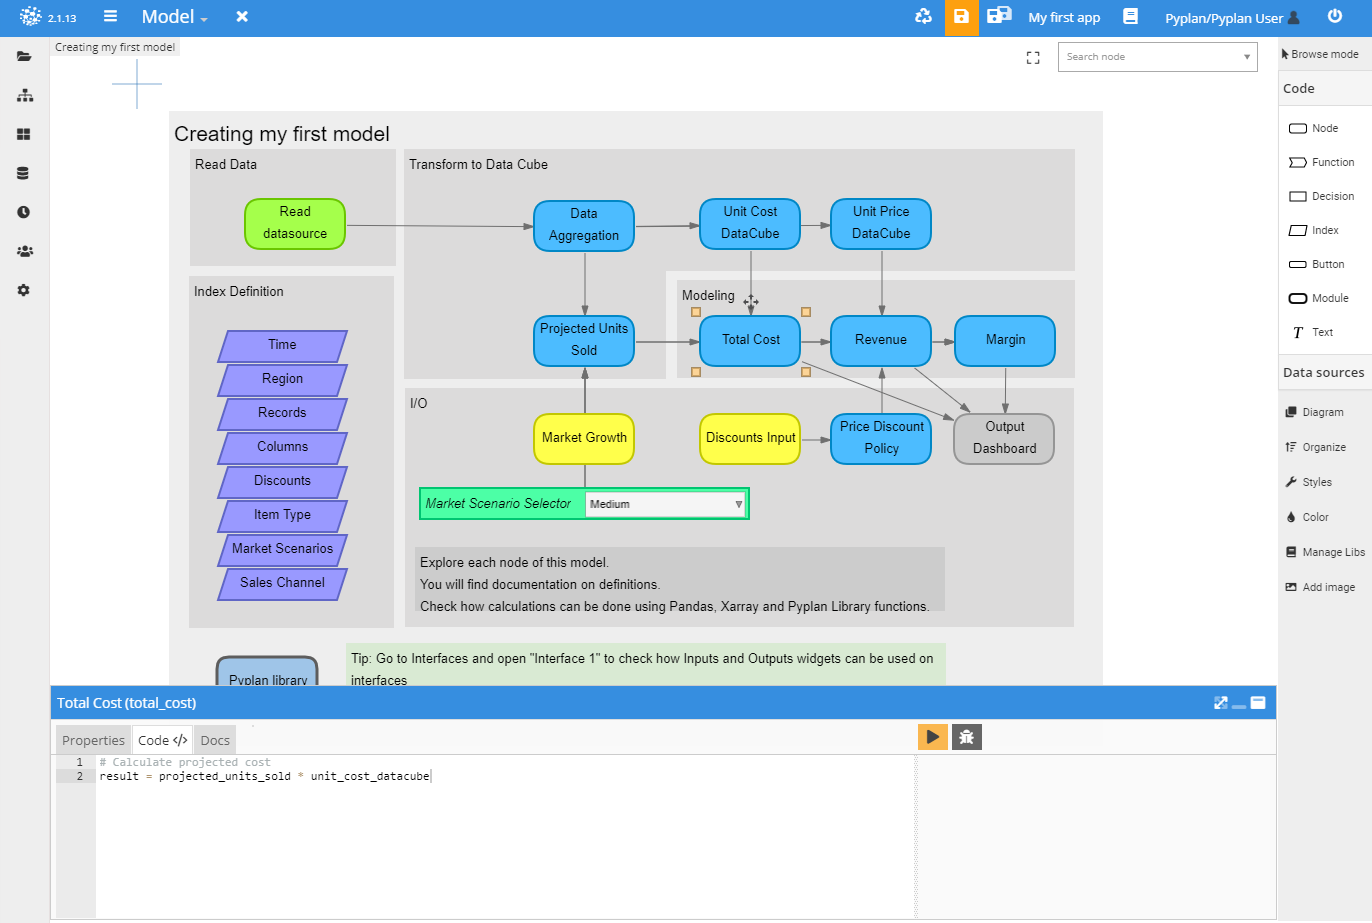
 Now you can inspect any node values by selecting and evaluating them. There are three alternatives for evaluating a node: The first one is by clicking on the “Run” button that you will find in the “Code” tab after selecting a node. The same result can be obtained by pressing Ctrl + return when editing the code. This will show/update the console output resulting from the evaluation of the node.
 Try adding
 print('Hello World')in the first line before the result definition.[L1] Run the node and check the console output. You will find this Printing functionality useful for inspecting intermediate values in your calculations.
The second alternative is pressing Ctrl+E after selecting the node. In this case, a more complete window opens showing this:
 Performance profiling information can be displayed by clicking on “Show Profile”
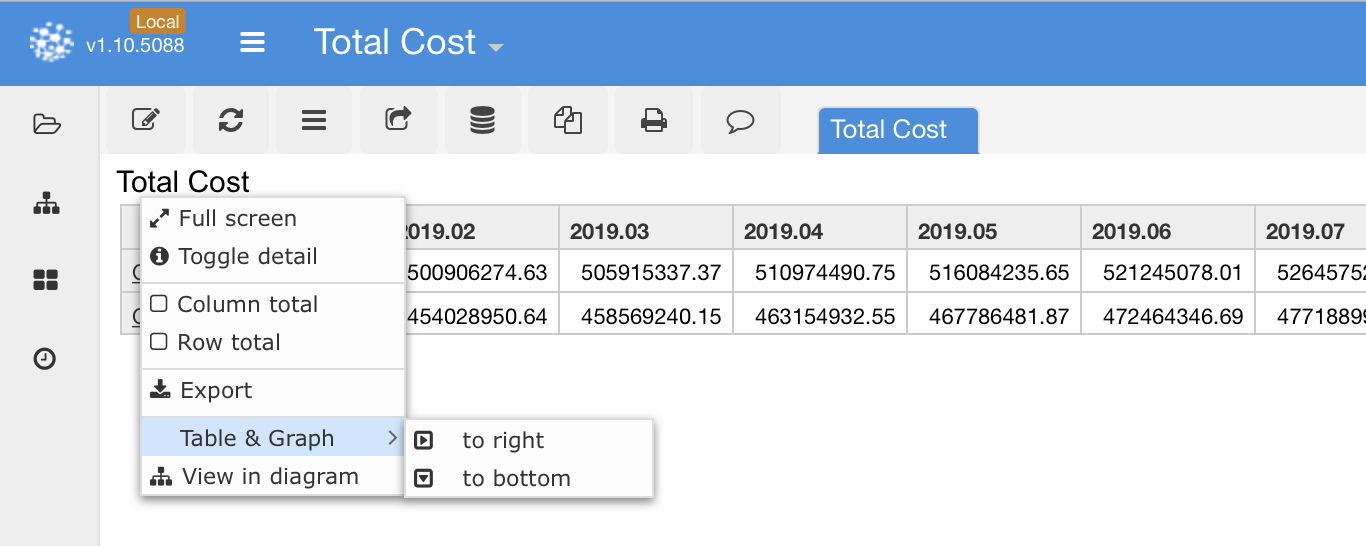
 The third way to run a node is by double clicking it or pressing Ctrl+R. Any node is initially evaluated as a table, until the user customizes its visualization. There is a customization group that can be rapidly set by clicking on the configuration icon next to the node title:
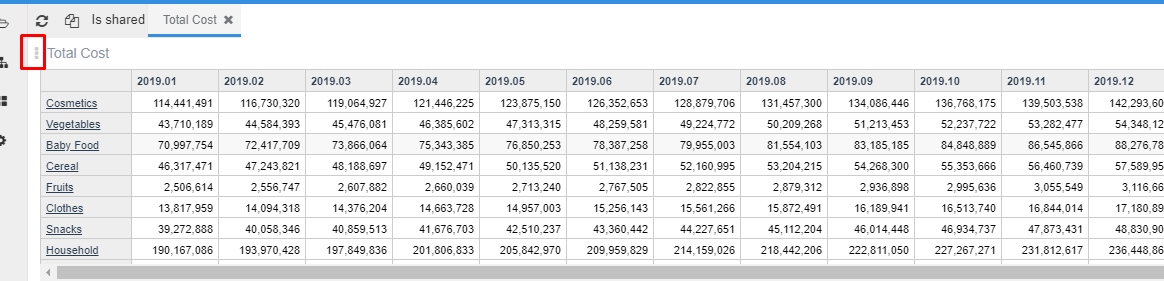
 One interesting feature is the ability to show the node result as a table and graph simultaneously. All customization parameters are lost when closing the node, unless you explicitly indicate that you want to set the current view as the default view for opening this specific node. To do that, you must click on the pencil icon
  , on the top left corner. This will open the visualization editor, which contains all the customization features. Click on the check mark to accept the changes and set the default view of the node.
Types of data structures natively supported
Pyplan supports programming in pure Python, and natively interprets Numpy, Xarray, and Pandas objects that are rendered as pivotable, multidimensional tables or graphs for inspecting results. It also interprets the figure object of Matplotlib, Bokeh and Plotly to render graphs created by those visualization libraries.
Understanding how does it evaluation works
When you request a node to be run, Pyplan traces all predecessor variables and runs them in sequence in order to compute every input this node needs. The results of intermediate nodes are stored in memory for future inspection. When the definition of a node changes, all downstream nodes are marked to be recalculated, so that the user does not need to be aware of the updated value of any predecessor variable when running a node.
Creating an App User Interface
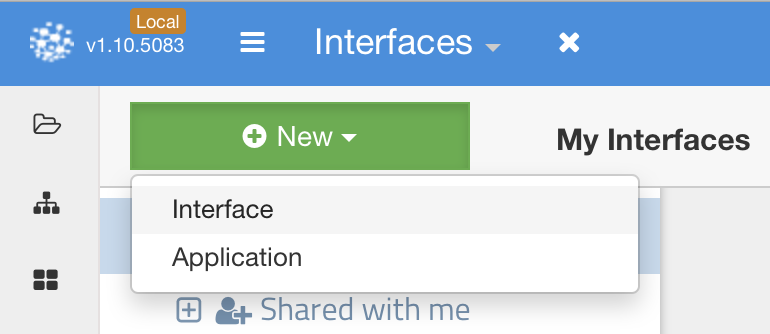
One of the most important characteristics of Pyplan is its ability to rapidly create and share apps. Apps are developed using one or more user interfaces. To start creating an app, first you need to go to the interface designer:
Click on the green “New” button, and then select “Interface.”
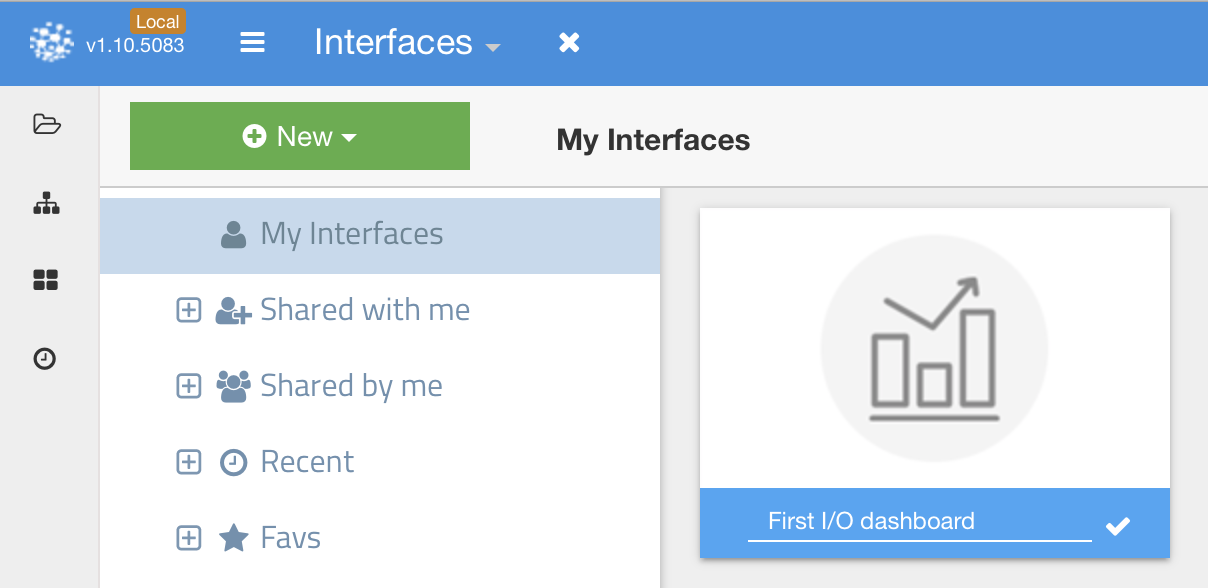
Enter the name “First I/O dashboard” in the name field for the new interface:
Now double click the new interface to start designing it:
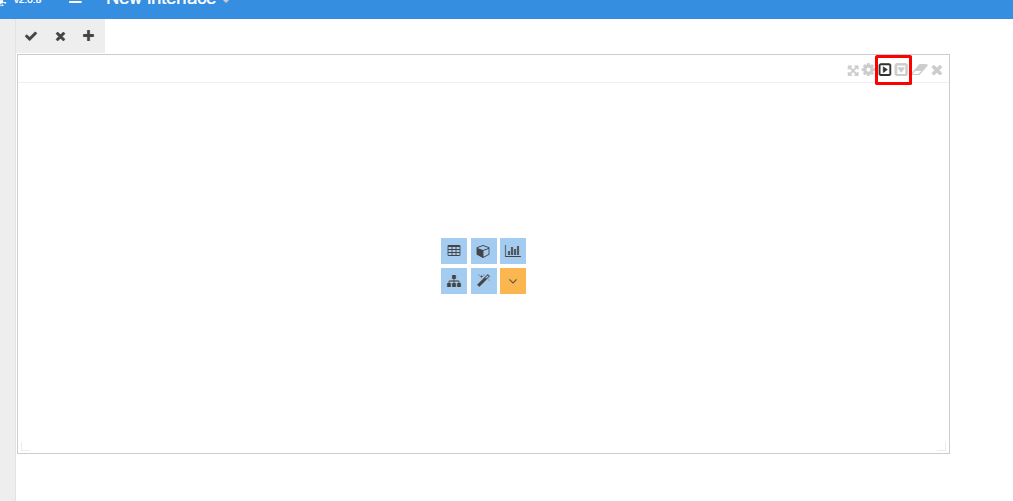
You can start by splitting the screen horizontally or vertically, and then indicating which node you want in each canvas. You can further divide the canvas any time.
Output Nodes
There are several types of components that can be included in an interface: Tables, Charts, Diagrams, Text, Filters, Pivot Tables, and Maps.
![]()
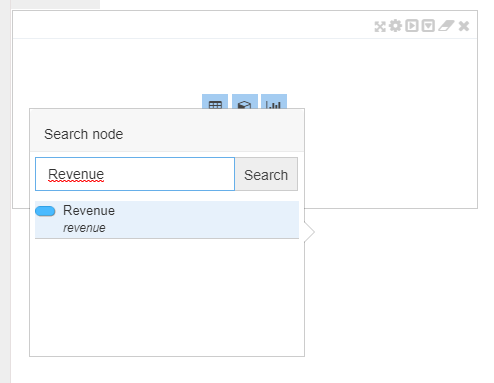
You can define what type of object you want in a specific section of the canvas, and then search for the node that contains the data to be shown.
Alternatively, you can display the diagram in one section of the canvas, then keeping pressed the Shift key
click on a node and keep it pressed to select it, and drag and drop it into the desired canvas section.
Input Nodes
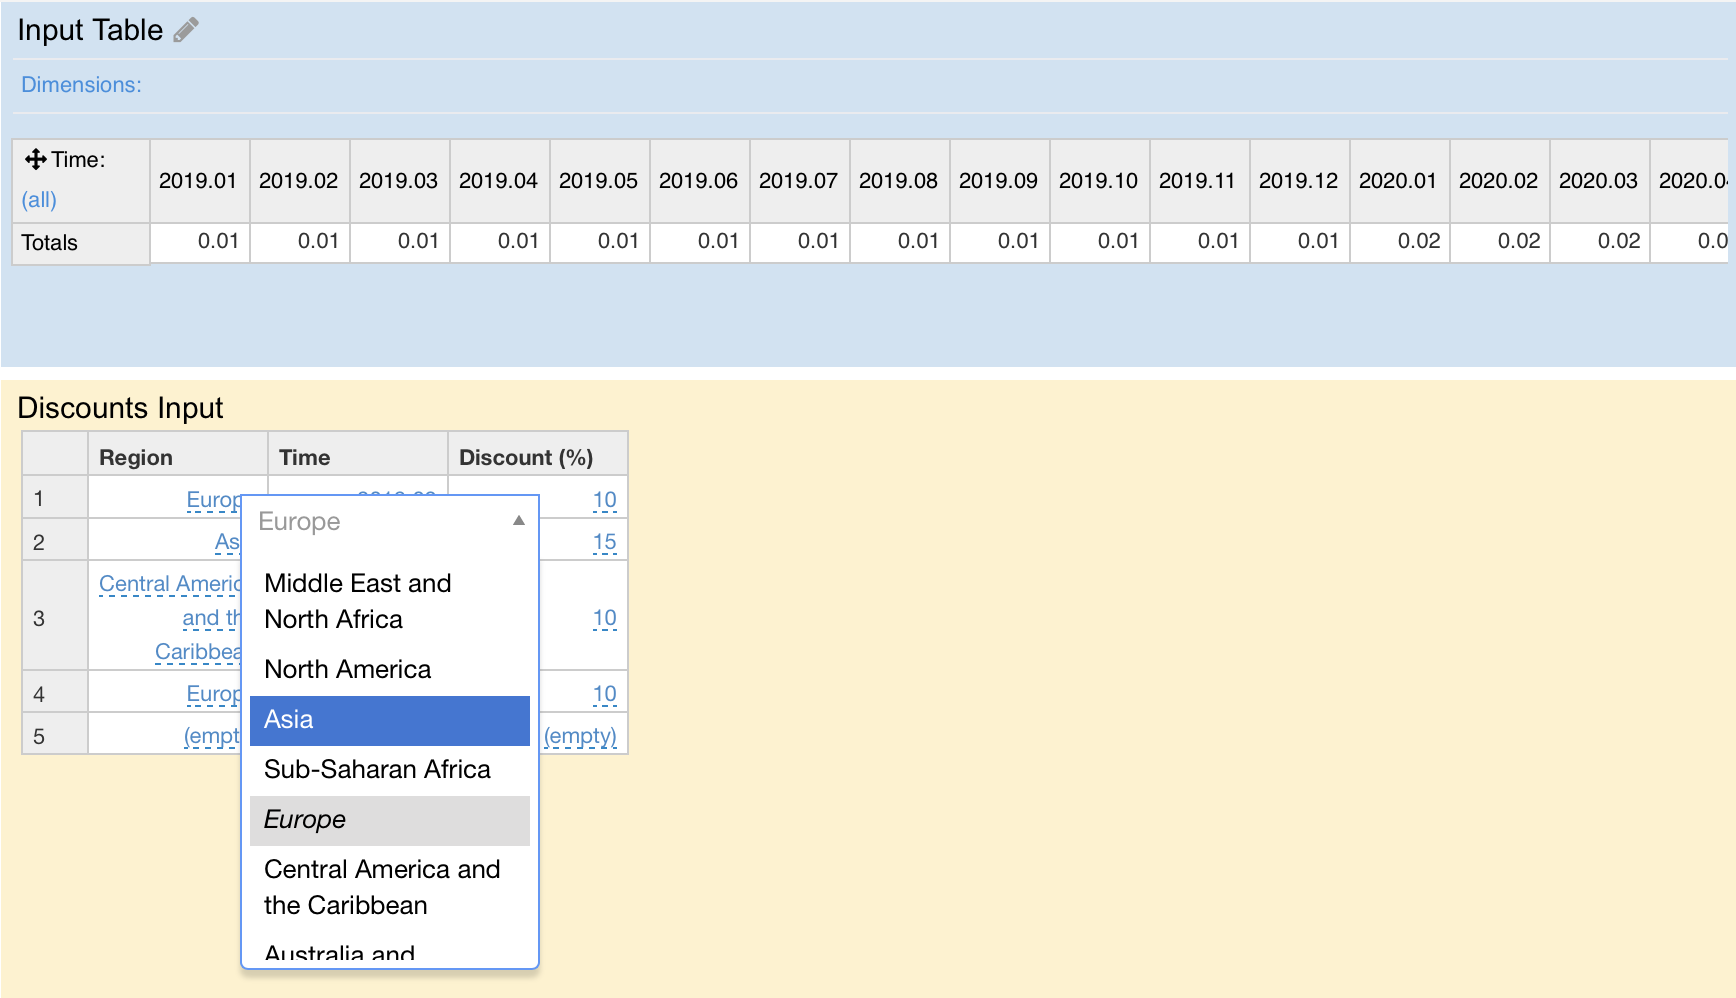
They are designed to enter data needed for the calculation logic of the app. They can be plain tables where to enter numbers, or tables from where to choose predefined options.
Controls
These are the elements used to interact with the app. They can take the form of filters that automatically apply to all nodes that share the same dimension, or of selectors for choosing specific slices of data.
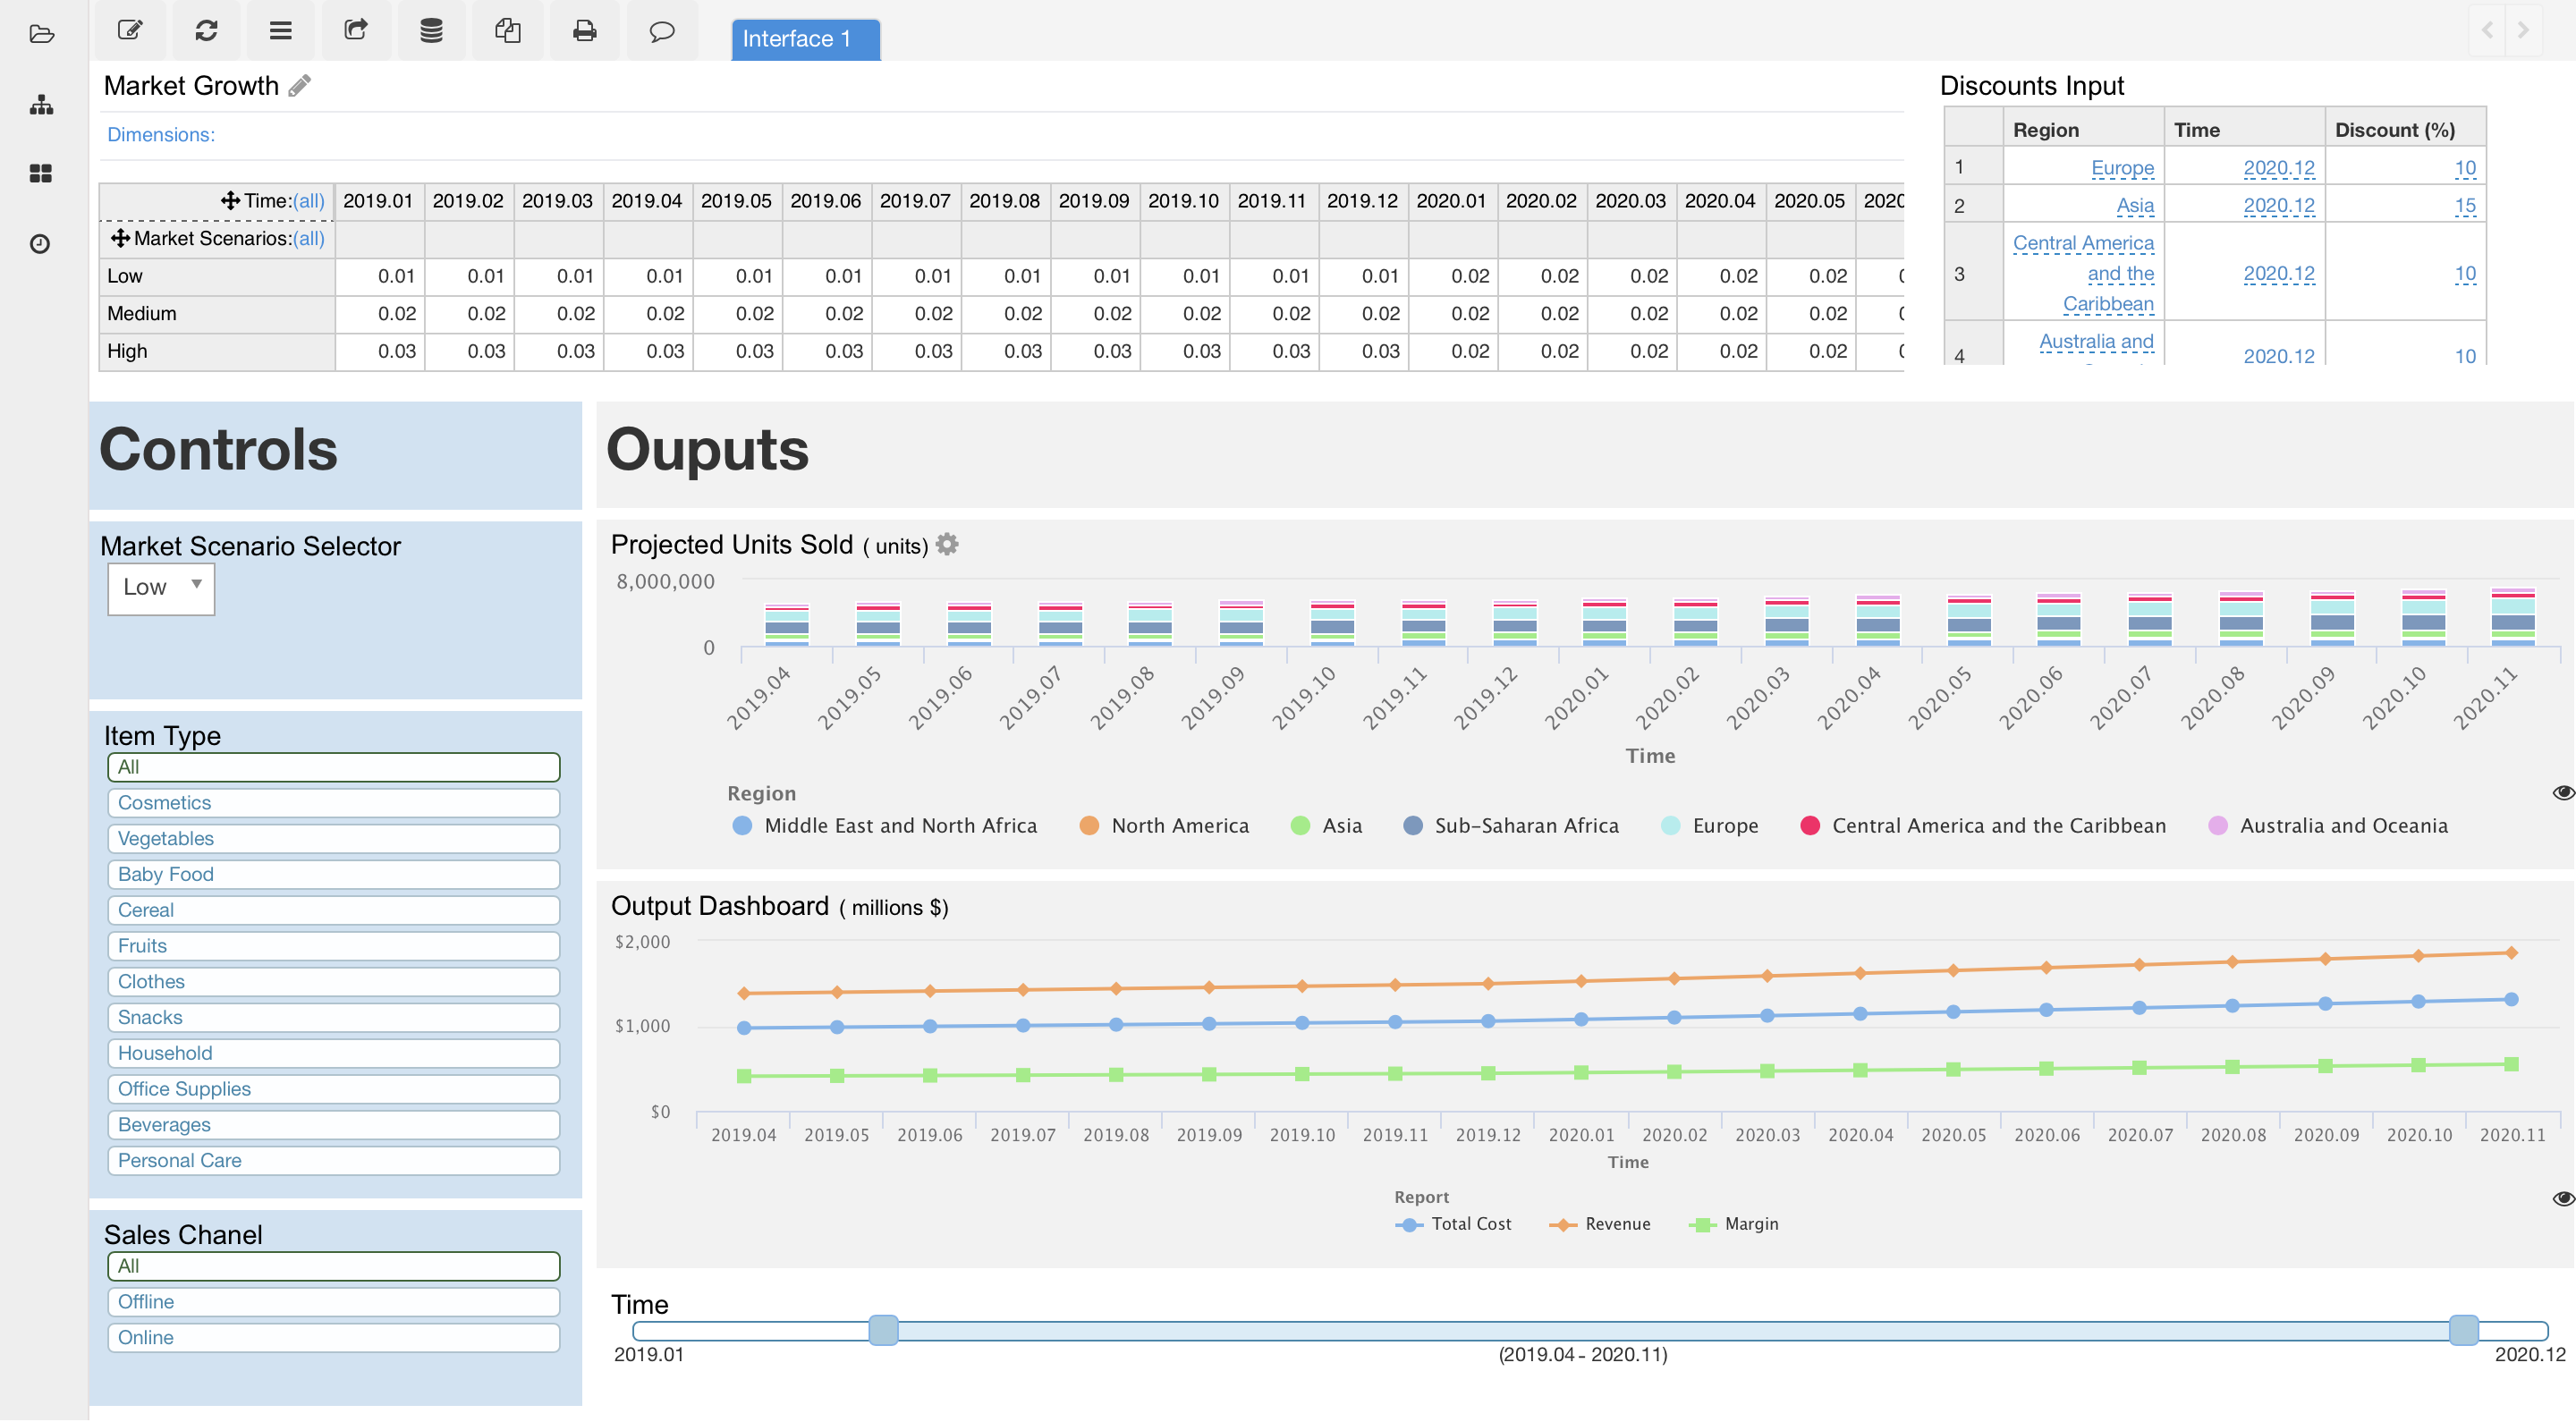 There are other types of controls, like buttons for launching specific tasks (scripts), or hyperlinks to create menus and navigate among interfaces.